Horizontal Design Response Spectrum
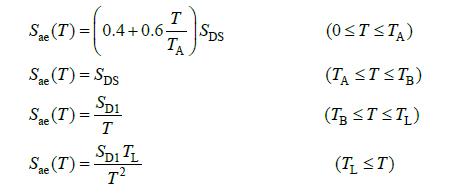
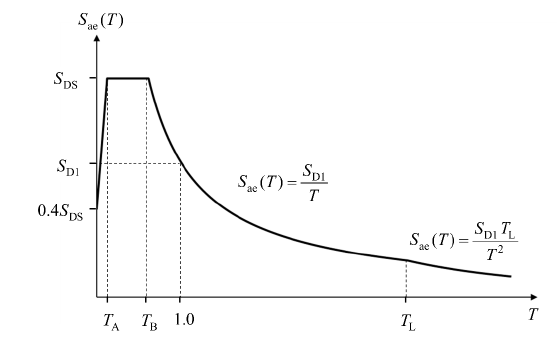
By using the coefficients obtained from the map by the program, the spectrum curve given in Figure 2.1 with Equation 2.2 - 2.3 is automatically obtained.
Symbols
FS = Local ground impact coefficient for the short-period region
F1 = Local ground impact coefficient for a period of 1.0 seconds
SDS = Short-period design spectral acceleration coefficient [dimensionless]
SD1 = Design spectral acceleration coefficient for a period of 1.0 seconds [dimensionless]
SS = Short period map spectral acceleration coefficient [dimensionless]
S1 = Map spectral acceleration coefficient for a period of 1.0 seconds [dimensionless]
T = Natural vibration period [s]
TA =Horizontal elastic design acceleration spectrum corner period [s]
TB = Horizontal elastic design acceleration spectrum corner period [s]
TL = Transition period to constant displacement region in horizontal elastic design spectrum [s]
Sae (T) = Horizontal elastic design spectral acceleration [ g]
Taking into consideration that an earthquake motion horizontal elastic design spectrum to the level ' s the ordinates of the horizontal elastic design spectral accelerations Sae ( T ), the gravitational acceleration due to the natural vibration period [ g ] is defined by the terms.
With the spectral acceleration coefficients obtained from AFAD depending on the coordinates, the horizontal elastic design spectrum Sae ( T ) is calculated according to the formula below . For the horizontal elastic design spectrum, it is represented by a total of 4 functions, different in each region, and shown in the graph below.


Spectral Response Acceleration Parameters.

In the Analysis Settings Wizard - Design Spectrums tab, the horizontal design spectrum is calculated and graphed by using the design spectral acceleration coefficients determined with online and offline options depending on the coordinates.
In Analysis Settings Wizard - Design Spectrums tab, horizontal design spectrum is calculated by using design spectral acceleration coefficients determined with online and offline options depending on the coordinates and its graph is created automatically.
Due to the need for site-specific analysis for ZF type soil, the calculation is not made in the above way. The calculated reduced design acceleration spectrum needs to be imported as a .txt file.
Differences between TBDY 2018 Acceleration Spectrum and DBYBHY 2007 Acceleration Spectrum
The design acceleration spectrum defined in TBDY 2018 differs significantly from DBYBHY 2007, the Regulation on Buildings to be Constructed in Earthquake Zones:
a- In DBYBHY 2007, the only parameter that defines the earthquake hazard is the effective ground acceleration coefficient Ao, while in TBDY 2018, the earthquake hazard is defined with two parameters S S and S 1 . The seismic zone concept that existed in DBYBHY 2007 does not exist in TBDY 2018. Instead of dividing the country into 4 regions, the spectrum obtained based on coordinates is more realistic. Below, DBYBHY 2007 effective ground acceleration coefficient is given according to earthquake zones.

b- While the local ground class was four in DBYBHY 2007, it was expanded to six with TBDY 2018. In DBYBHY 2007, local ground conditions affect the corner periods T A and T B , but only the decreasing region of the spectrum (constant spectral velocity region) is affected by local ground conditions. In TBDY 2018, all regions of the spectrum are affected by local ground conditions with the F S and F 1 coefficients in TBDY Equation (2.1) . Below, DBYBHY 2007 corner periods are given according to local soil classes.

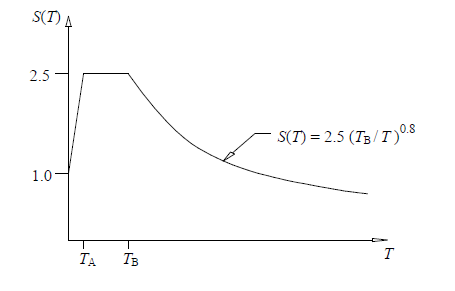
c- The decreasing region of the spectrum (constant spectral velocity region) In DBYBHY 2007, spectral acceleration changes with the inverse of T 0.8 , while in TBDY 2018 it changes with the inverse of T. As a result, spectral acceleration decreases relatively in long periods. Below are the functions of three regions of DBYBHY 2007 elastic design spectrum.

d- In the spectrum, T L = For periods longer than 6 seconds, the fixed spectral displacement region is passed (See. TBDY Figure 2.2) and the spectral acceleration in this region changes with the inverse of T 2 . Below is the graph of DBYBHY 2007 elastic design spectrum.

using the coefficients obtained from the map by the program, the spectrum curve given in Figure 2.1 with Equation 2.2 - 2.3 is automatically obtained.
Next Topic
