
-
The bearing strength of reinforced concrete columns is calculated automatically by taking into account the axial force and biaxial bending interaction.
-
The three-dimensional interaction curve consisting of axial force and biaxial bending interaction is automatically calculated according to the section and reinforcement status.
Notation
E s = Reinforcement modulus of elasticity (= 2 x 10 5 MPa)
f cd = Concrete design compressive strength
f yd = Design yield strength of longitudinal reinforcement
σ c = Concrete stress
σ s = Reinforcement stress
σ co = Compressive strength of unconfined concrete
ε cu = Concrete crush strain
ε s = reinforcement strain
ε water = Reinforcement rupture strain
The design of reinforced concrete columns is made by calculating the axial pressure and the bearing strength under bending in two directions. In the DGT approach, the design of the columns is made by calculating the moment strength calculated using the moment-curvature relation at each axial force level, according to the material conditions given in TS500 . The assumptions given in TS500 7.1 are as follows.
-
The tensile strength of concrete is neglected.
-
It is assumed that there is full adherence between the reinforcing bar and the surrounding concrete.
-
Plane sections remain plane after deformation.
-
When the unit shortening in the concrete pressure fiber farthest from the neutral axis reaches cu = 0.003 or the rupture strain of the reinforcement reaches ε su = 0.1, the element has reached its bearing capacity.
-
Reinforcement steel exhibits elasto-plastic behavior.
-
σ s ≤ f yd is σ s = E s ε s ≤ f yd
-
σ s > f yd is σ s = f yd
-
-
The modulus of elasticity of reinforcing steel is E s = 200000 MPa.
-
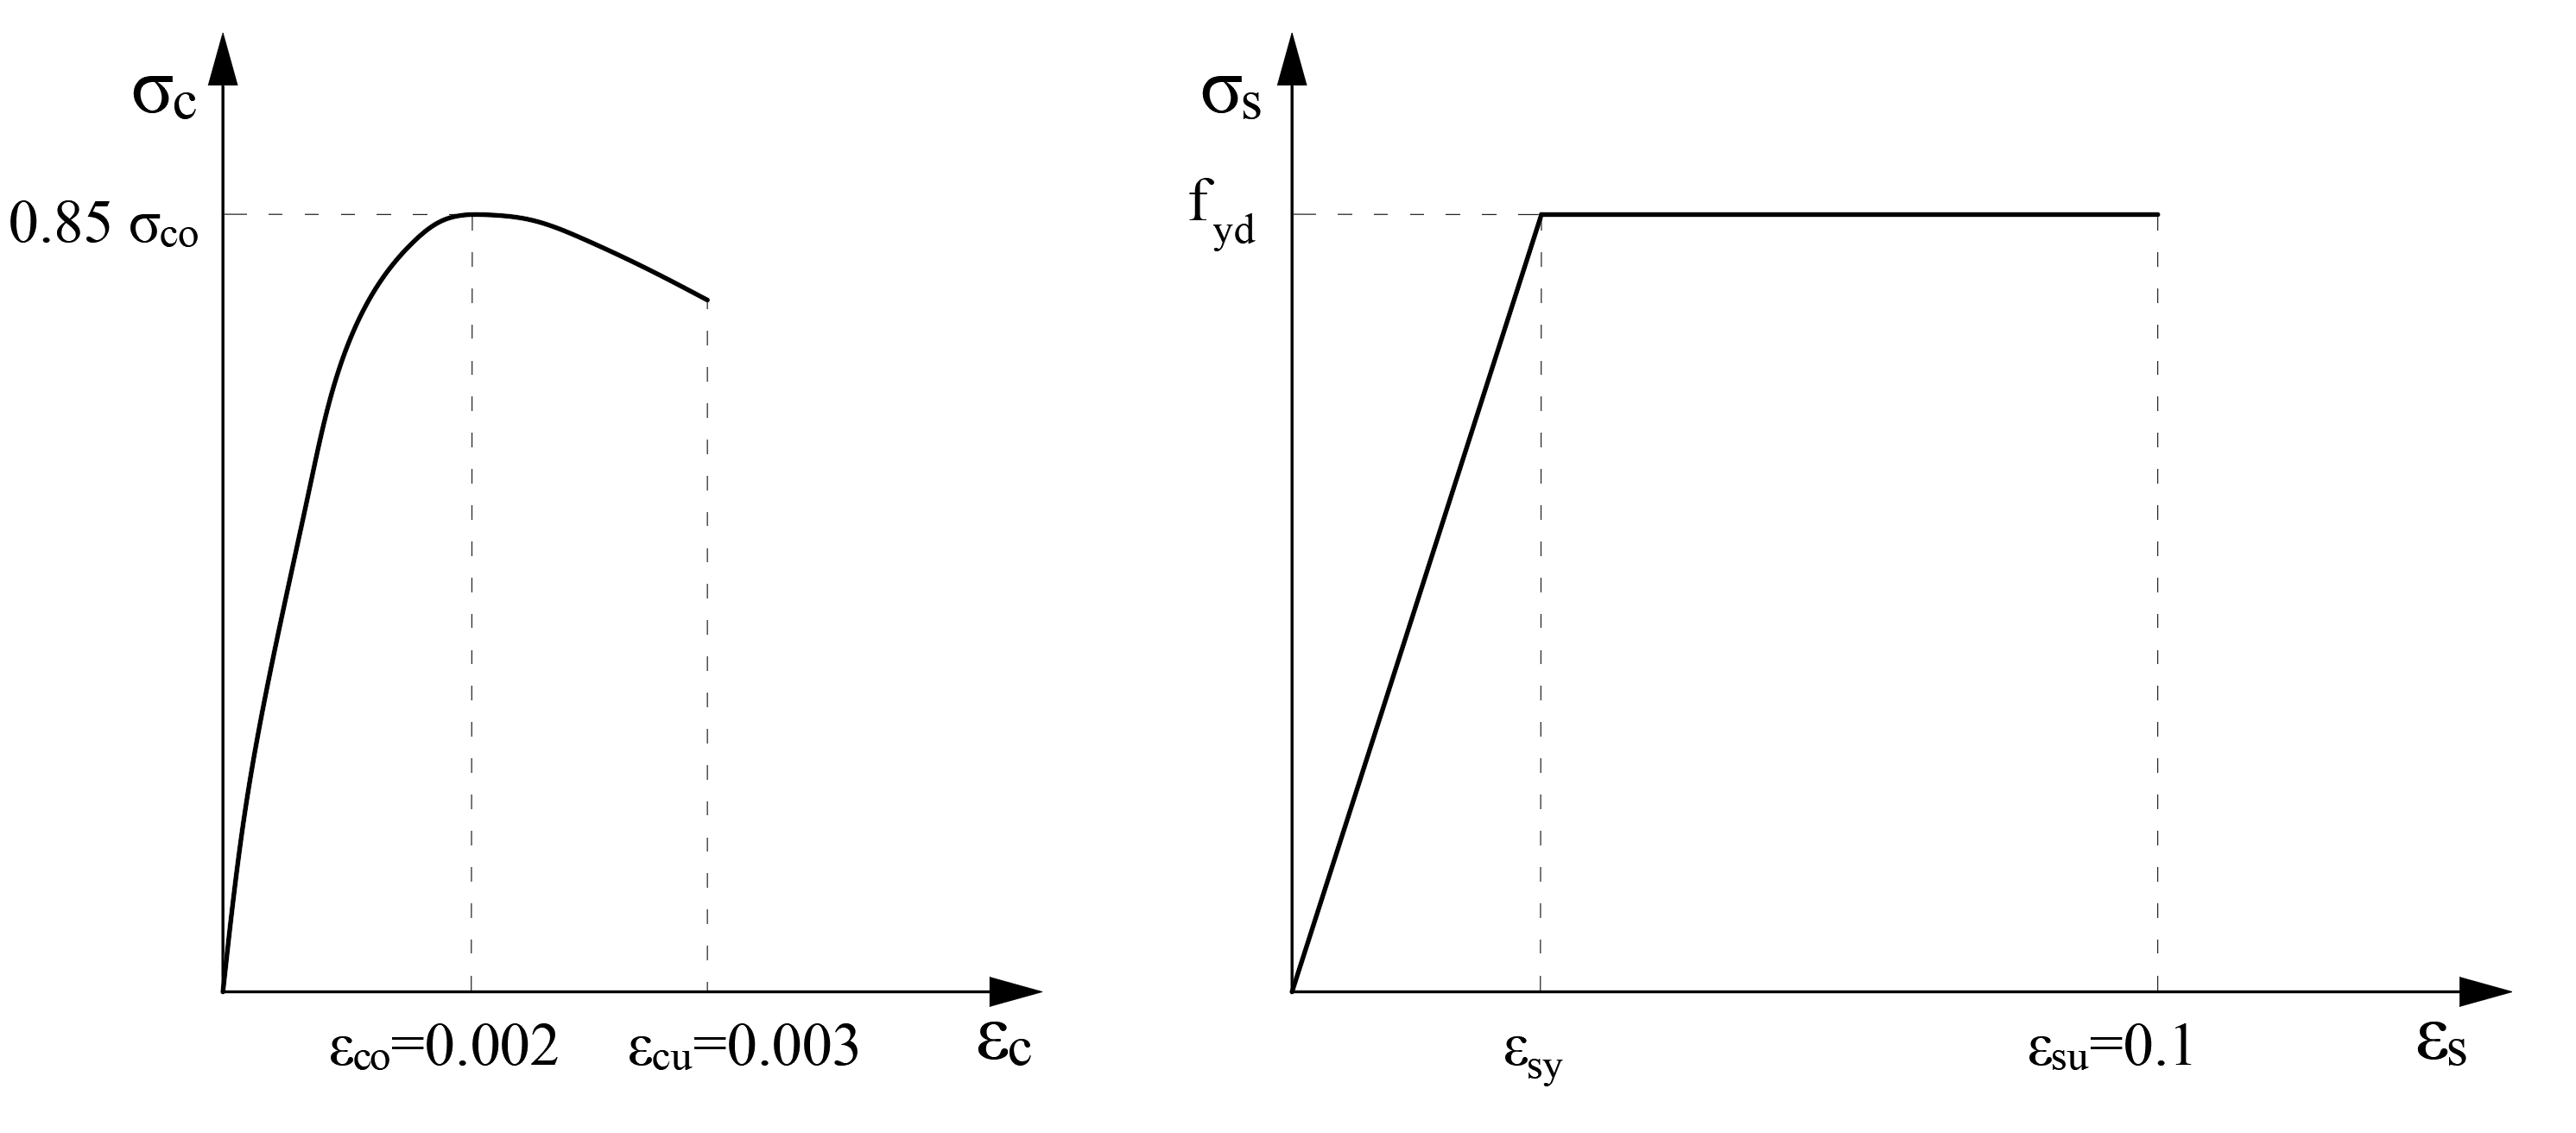
For the stress distribution in the concrete pressure certificate, the uncoiled concrete model given in TBDY Annex 5A is used.
-
The concrete stress-unit strain graph is drawn so that the highest concrete compressive stress value is 0.85f cd .
Considering the above assumptions, the moment curvature plot of a column with the DGT approach is drawn using the section cell fiber model (fiber model) as shown below.
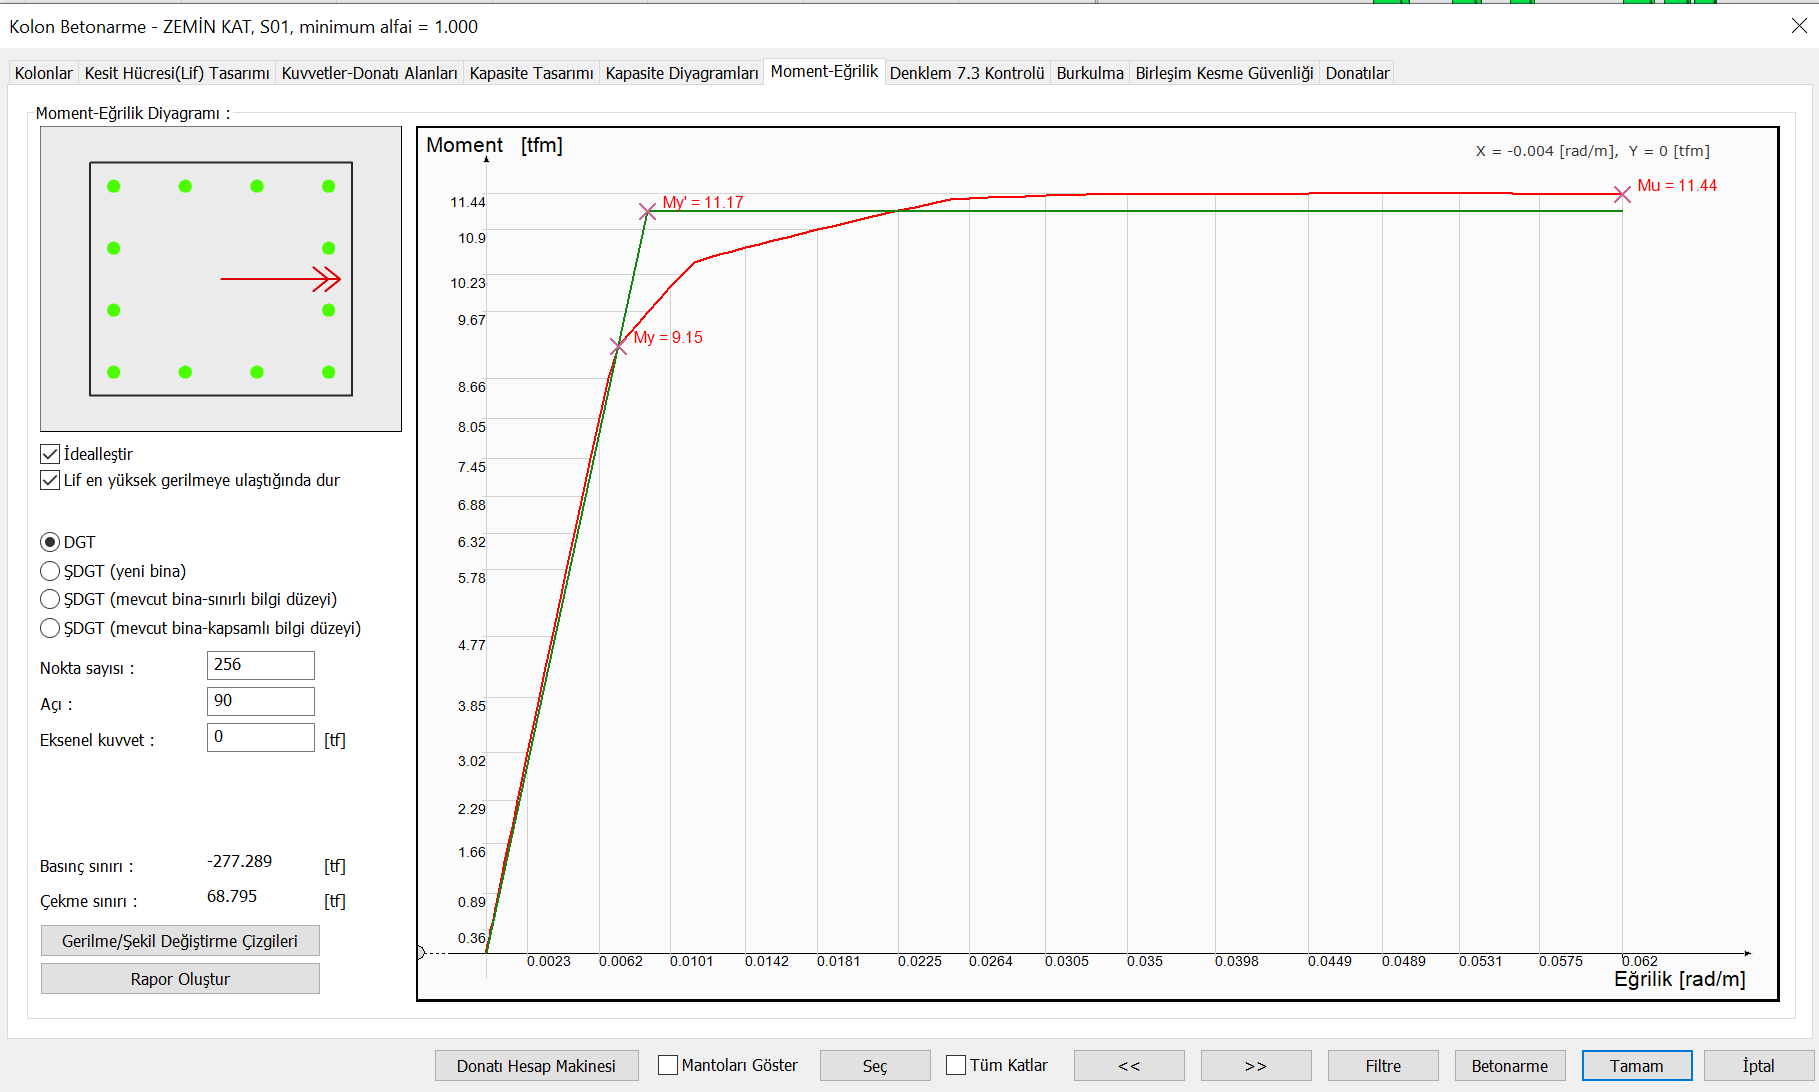
Concrete and reinforcement material models are shown below.
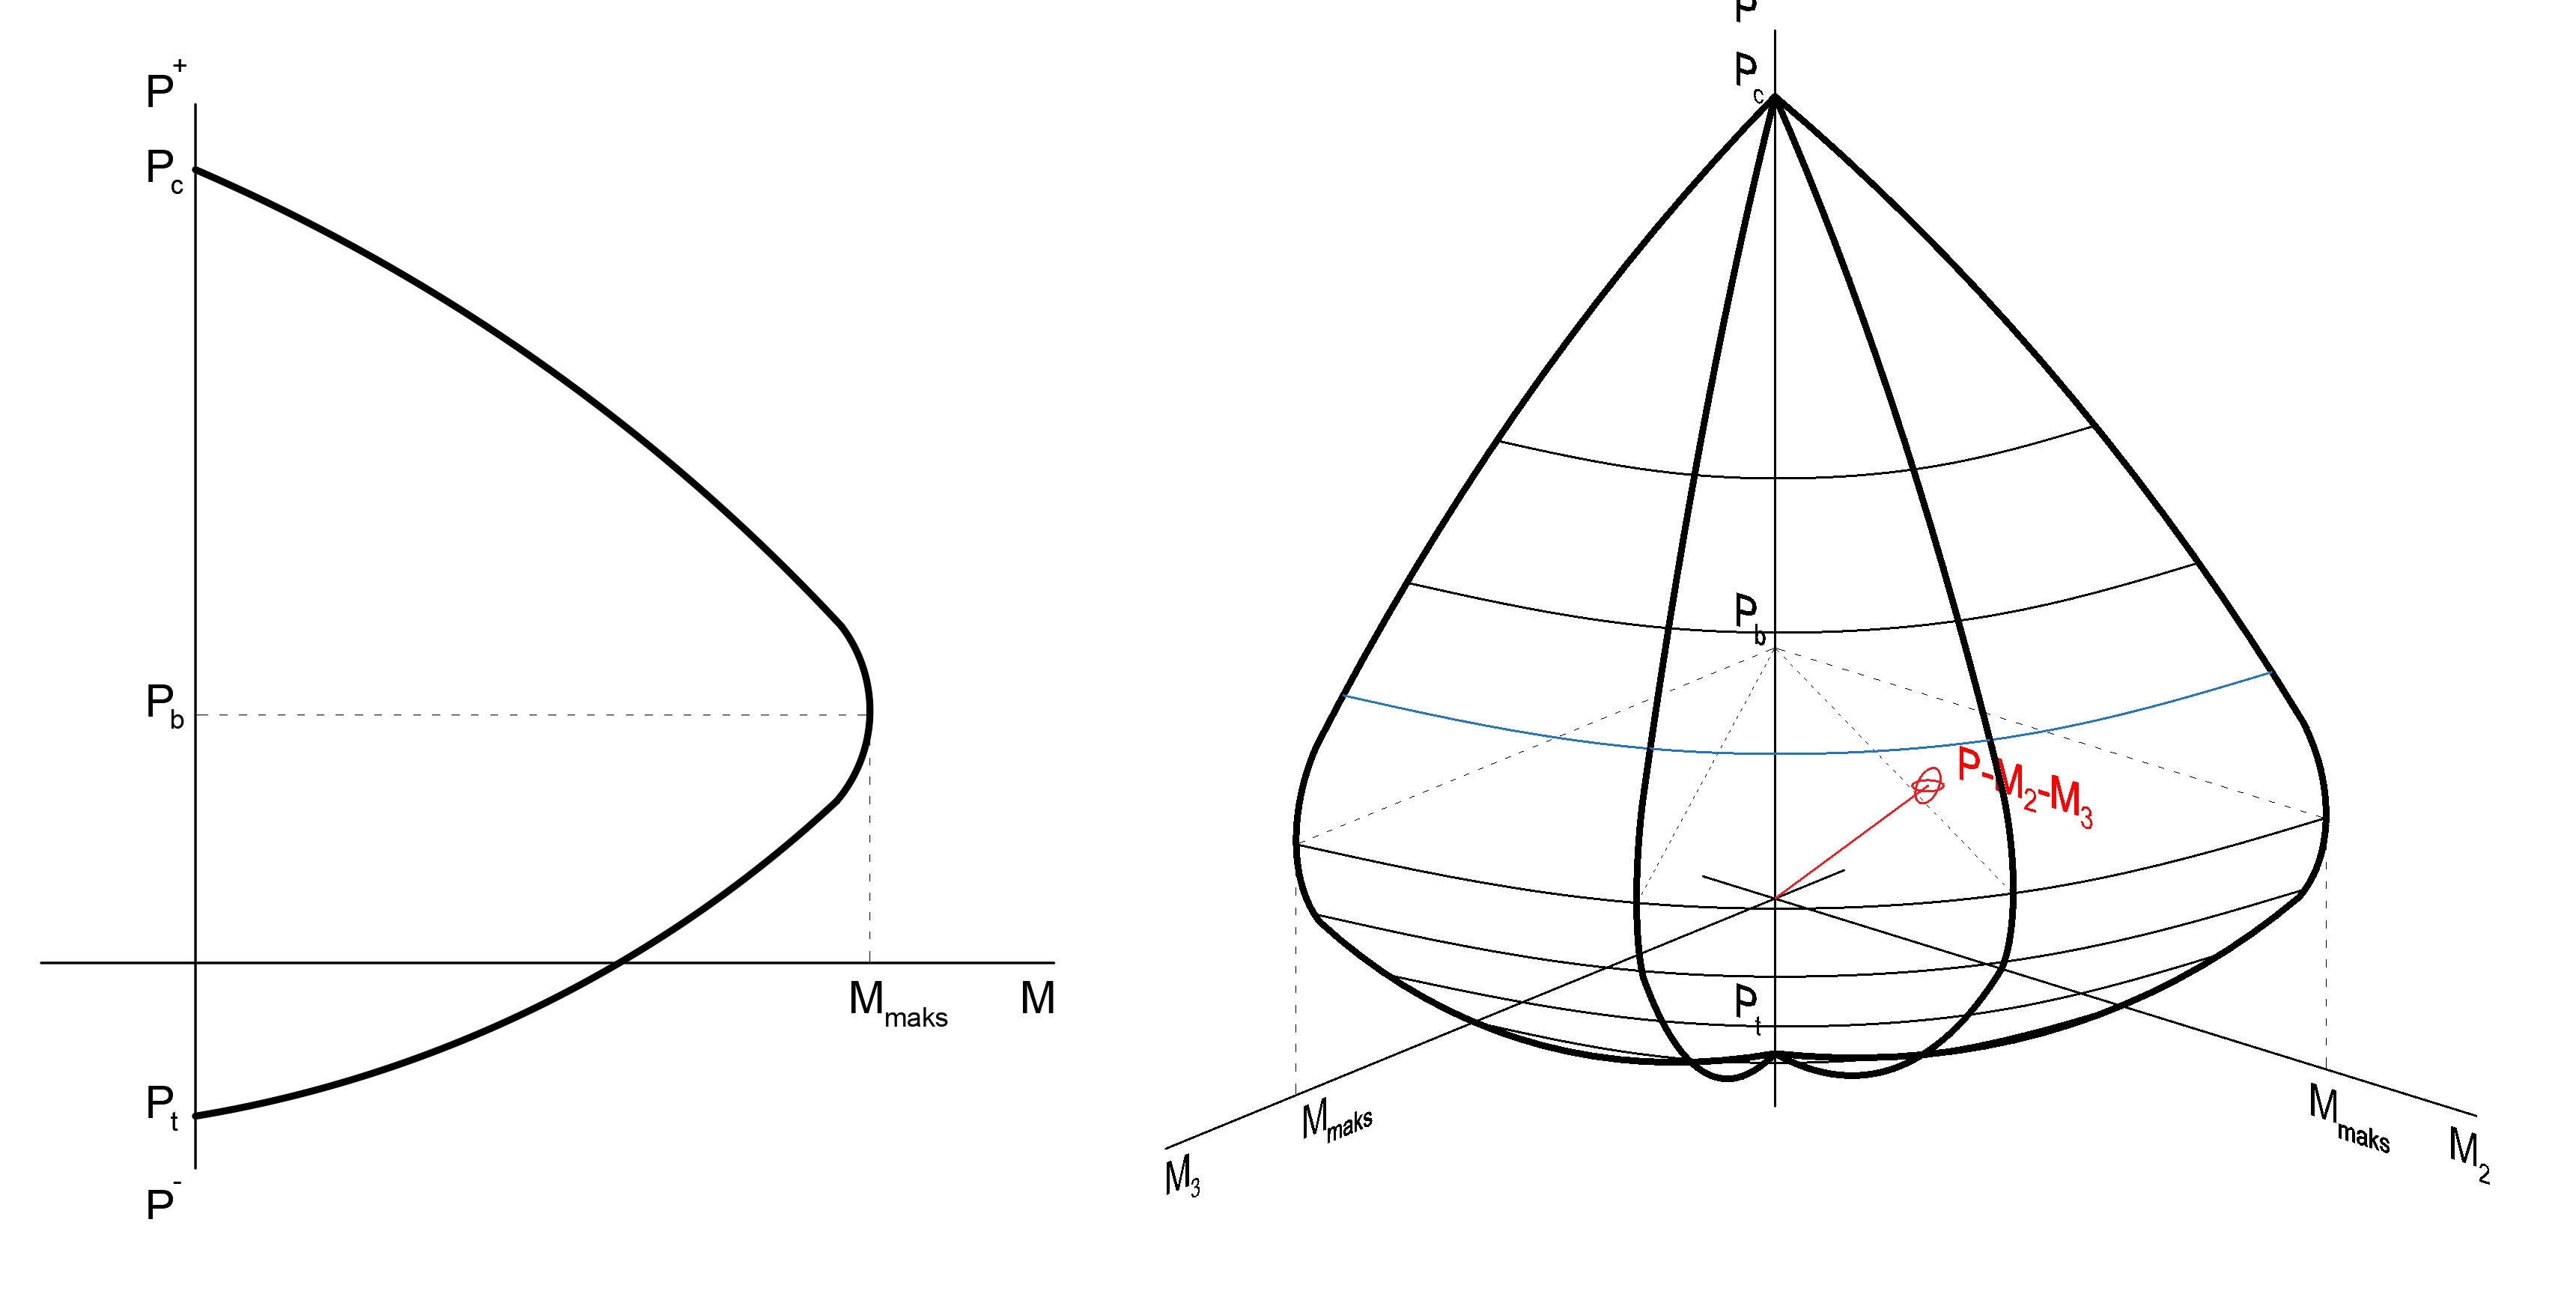
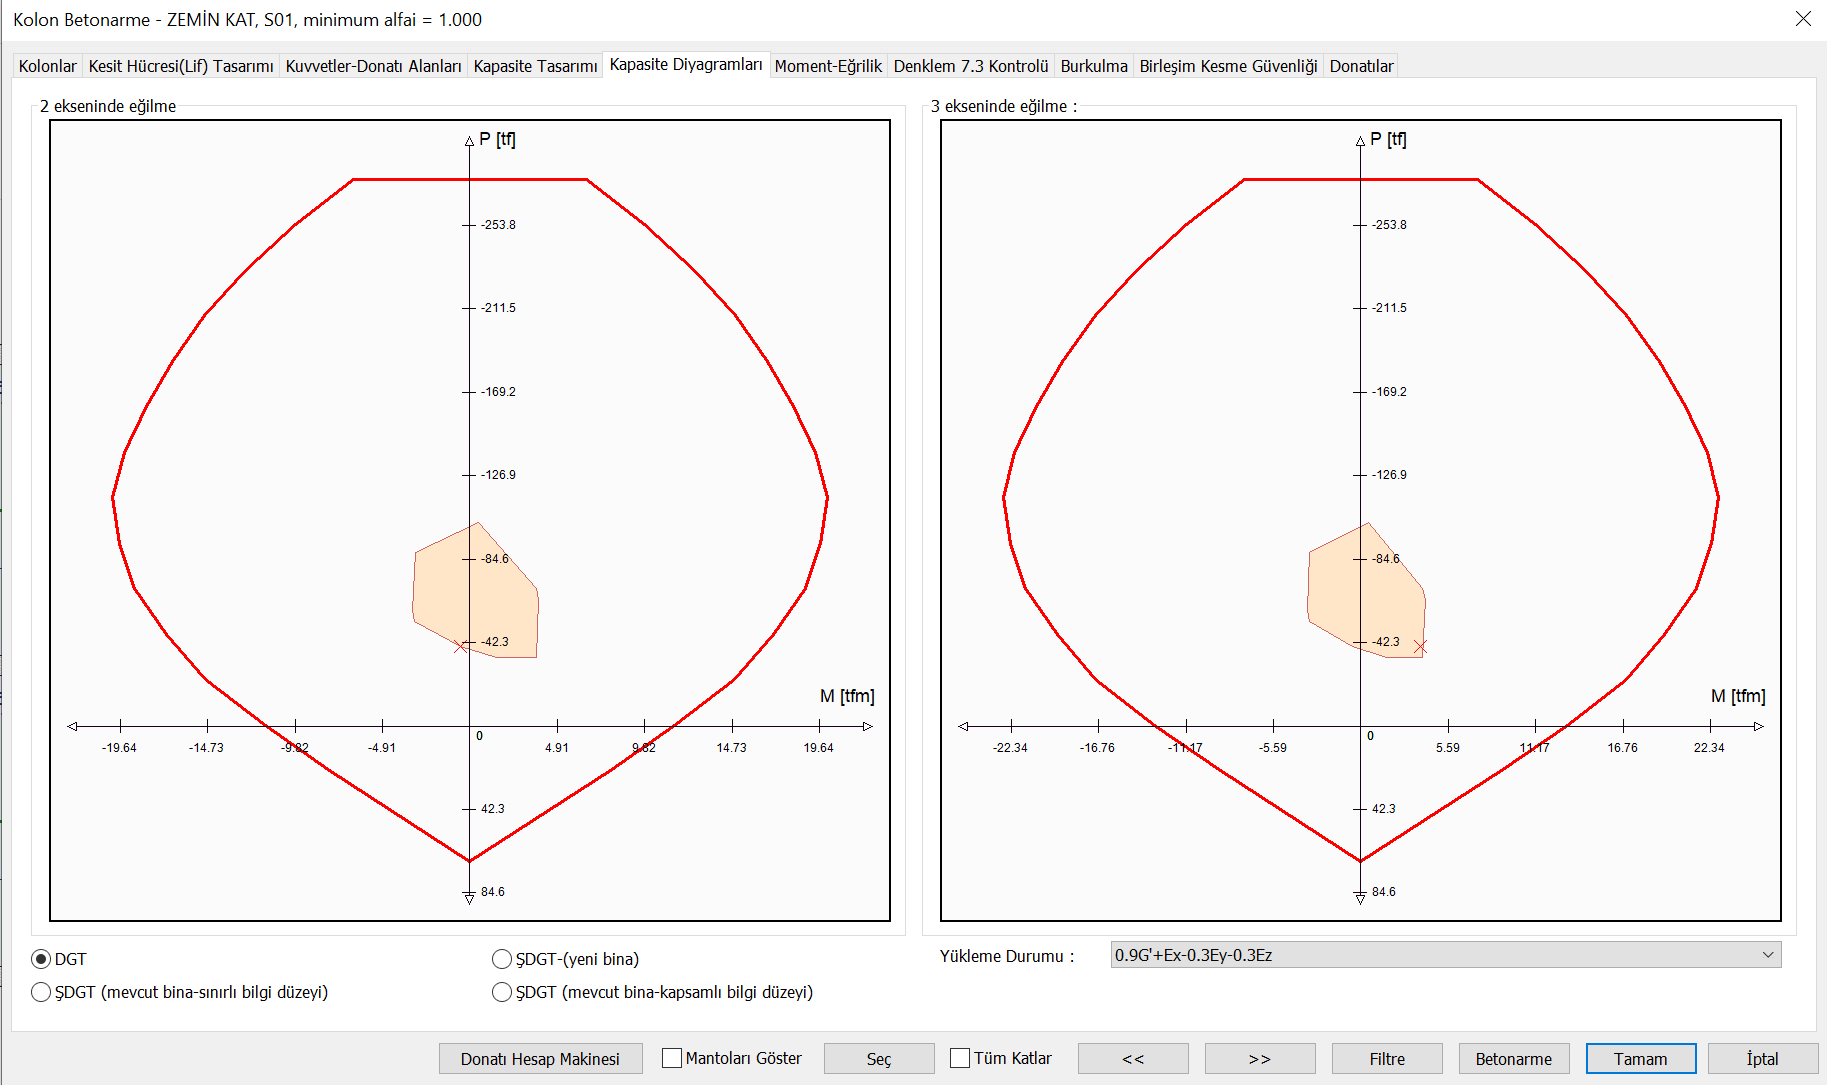
In the moment curvature graph drawn using the section cell fiber model at each axial force level, the column carrying power M u changes. This change is shown by the interaction curve. The picture below shows the two-dimensional graph of the axial force and biaxial bending interaction and the 3-dimensional graph used in the design.
Calculating the Capacity Ratio in Columns
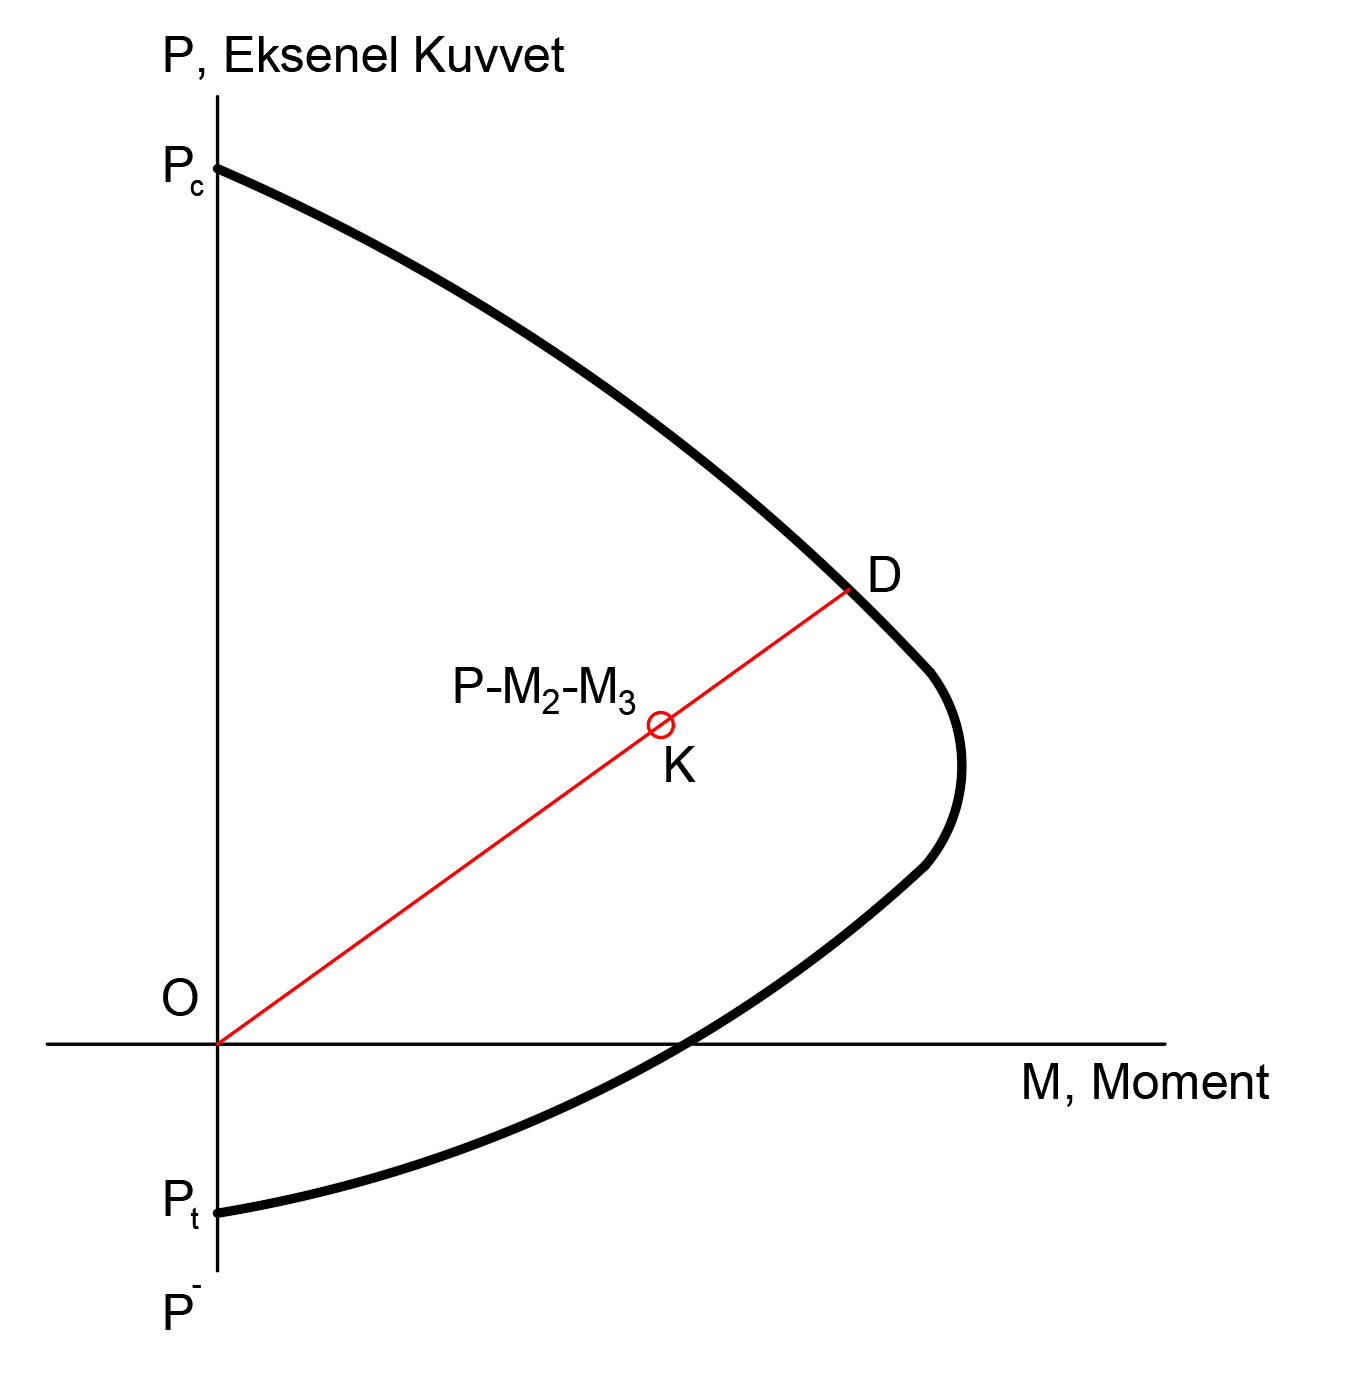
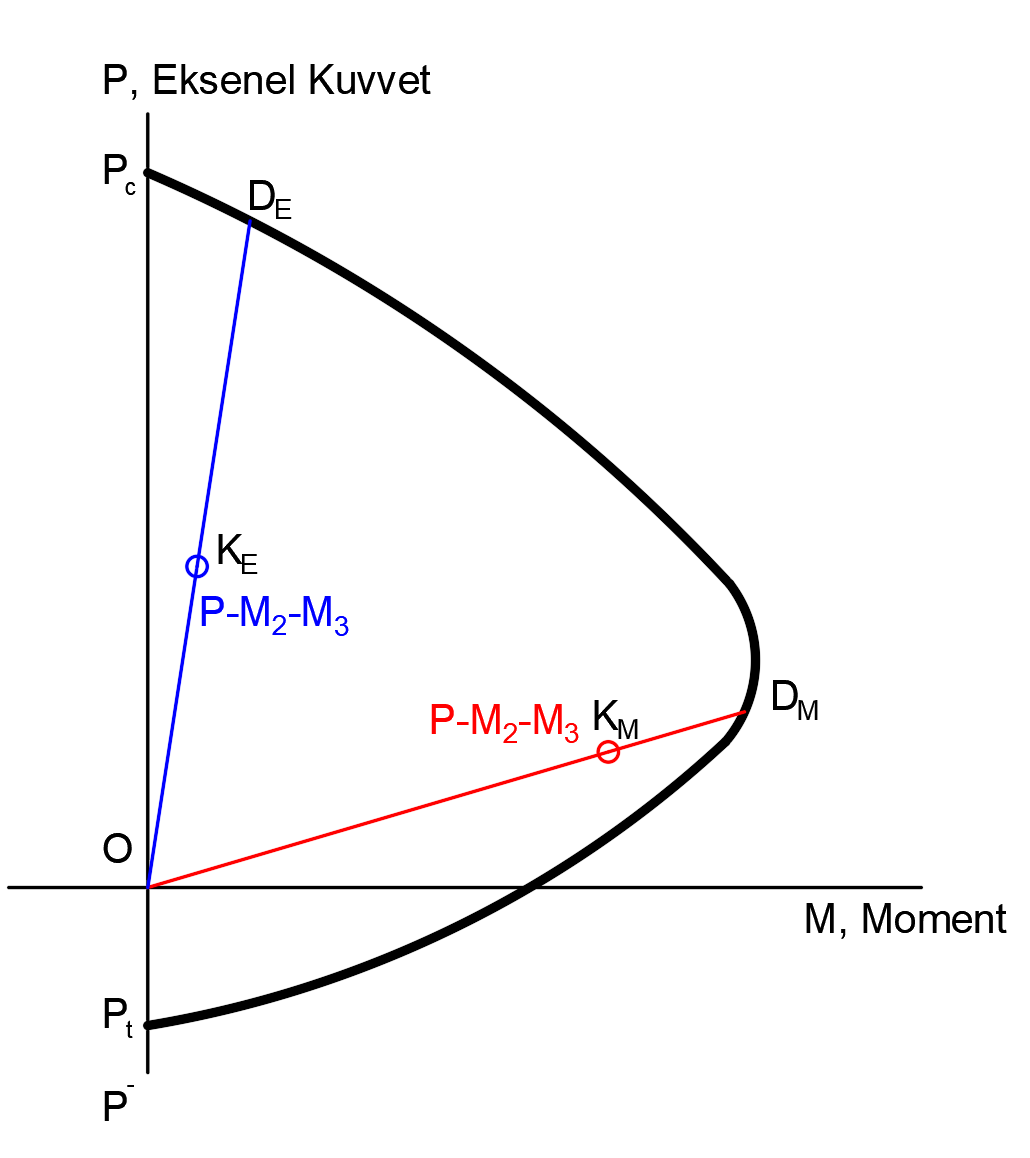
Because of the axial force and biaxial bending interaction in the columns, the capacity ratio is calculated using these interaction curves. The image below shows a typical column interaction curve. This interaction graph is obtained with the section carrying power in the moment curvature relationship described above and calculated at each axial force level. On this graph, axial force and biaxial bending moment values from load combinations are shown with point K. Then a line is drawn from the starting point O to the point K and this line is extended up to the capacity curve. The point where the line in question intersects the capacity curve is shown with D. Capacity ratio of this OK lengthOD It is determined as the ratio of length.
In this case, the ratio of capacity in the columns = OK / OD
As explained above, the capacity ratio can take different values for each axial force and biaxial moment values. The following figure for a concrete column M 2 and M 3 interaction curves calculated for the axis are shown. However, the interaction curve used in the column design is calculated in three dimensions.
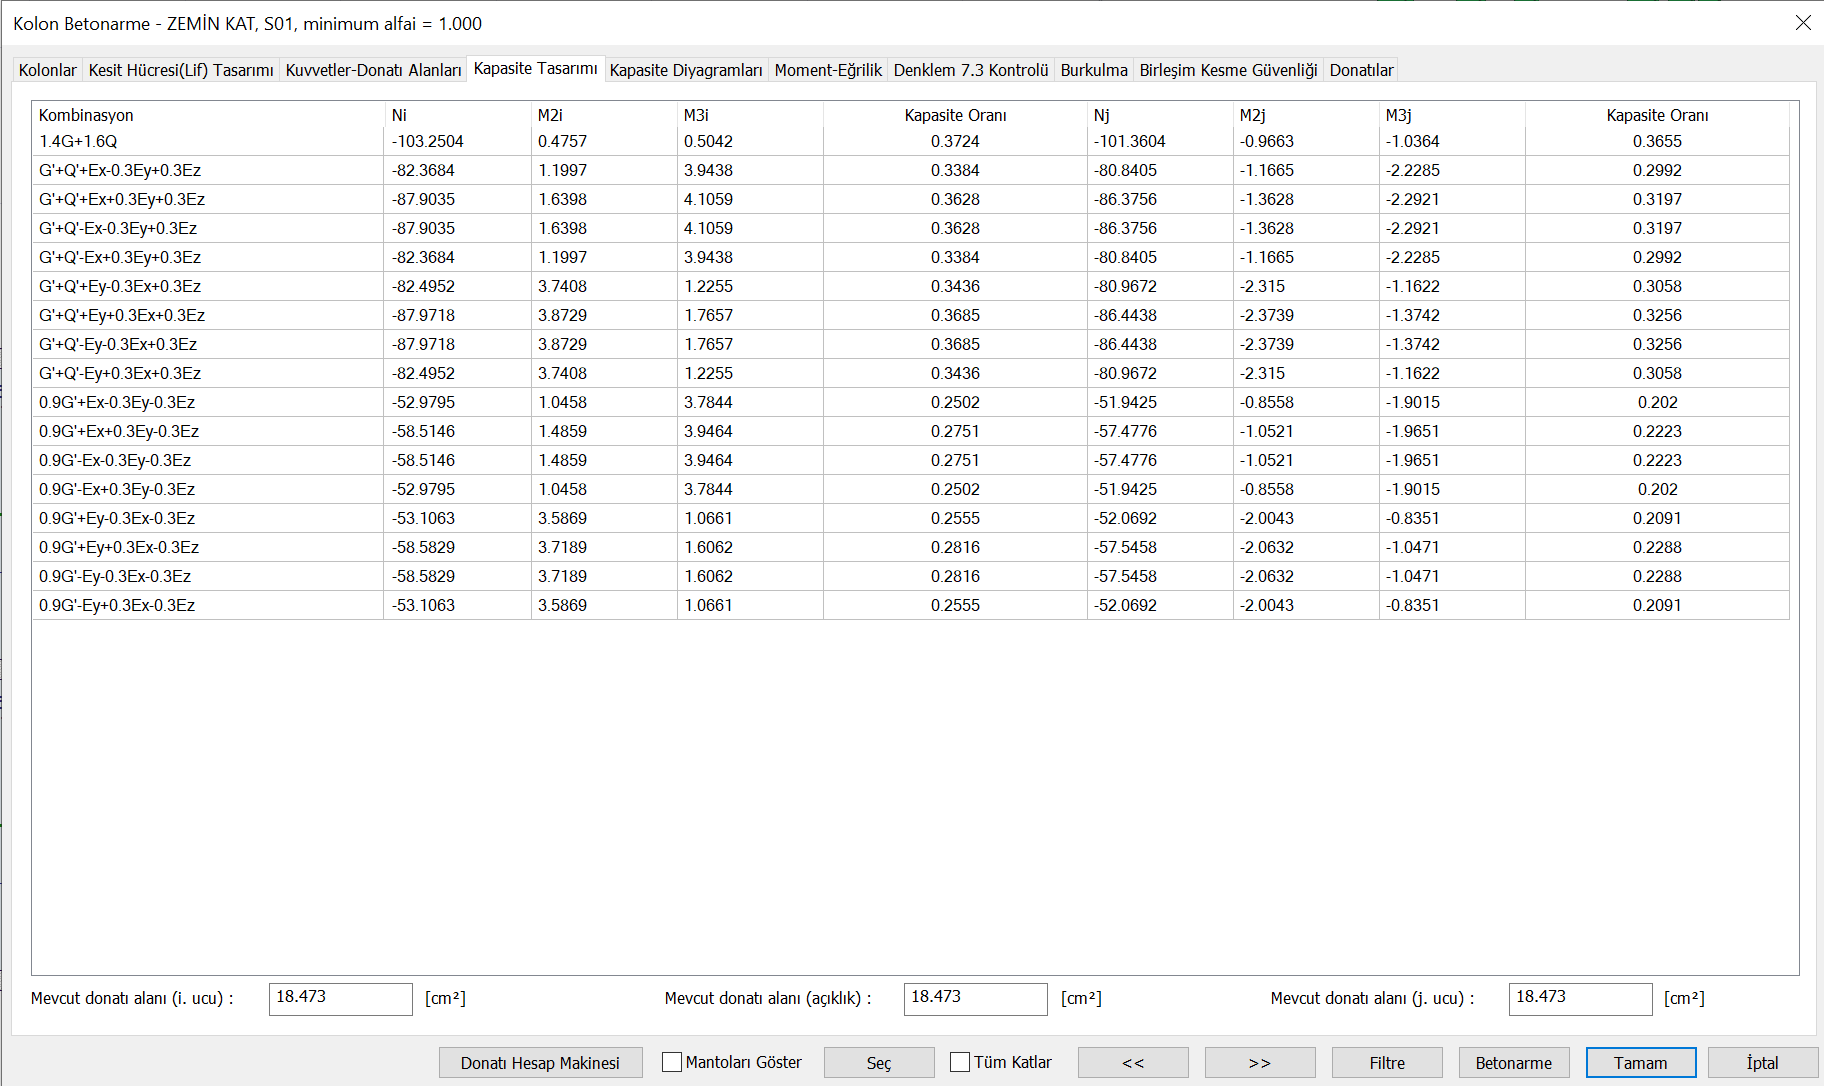
In the "Capacity Design" tab of the "Column Reinforced Concrete" window , the capacity ratios in each loading combination are calculated using the principles described above.
Since the capacity ratios are not calculated by considering only one effect (axial force or moment), there may be differences in the capacity ratios. For example, in the interaction curve shown in the figure below, let the capacity line shown in blue color is Axial Force weighted, and the line shown in red is weighted with the moment effect. In the case shown by the blue line, the design ratio will be OK E / OD E. The ratio for the case shown by the red line arrows M / OD M will be. In this case OK E / OD E > OK M / OD Mis found as. The design ratio of the blue line is smaller than the design ratio of the red line, although the axial force in the loading state of the blue line is greater than that of the red line. In this case, a design ratio made by considering only the axial force effect and axial capacity would not give the correct behavior.
Next Topic