
-
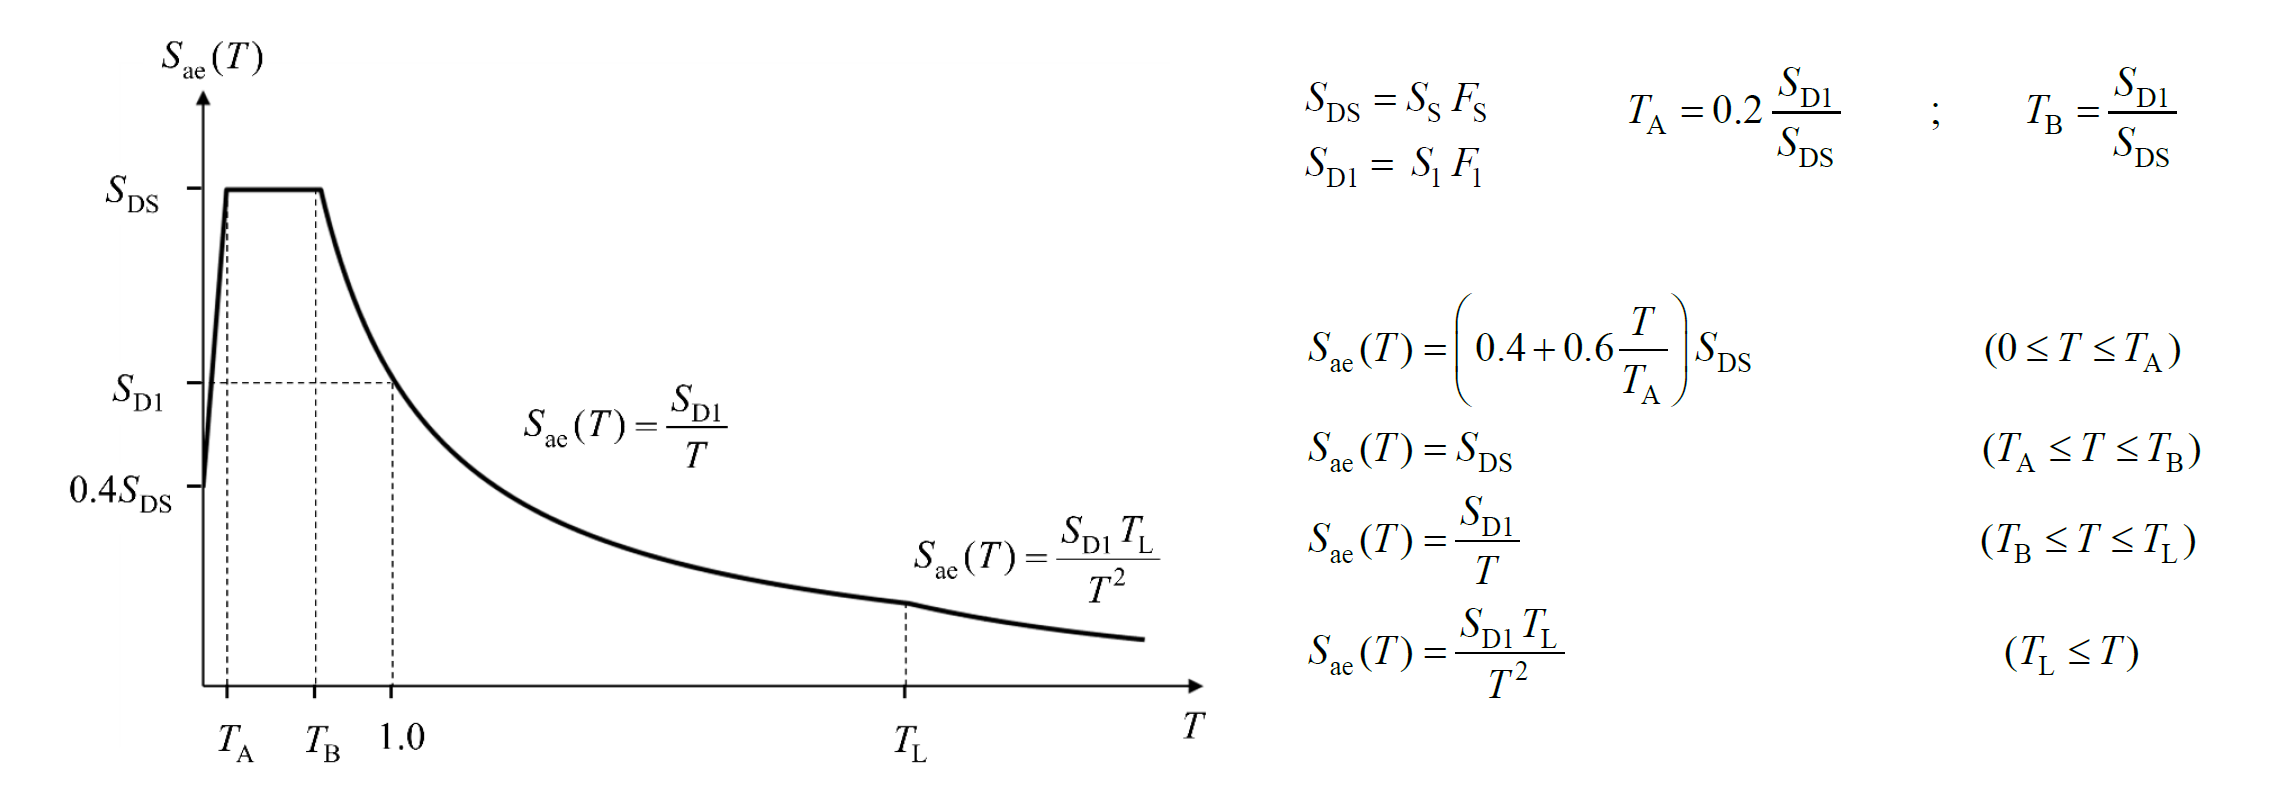
By using the coefficients obtained from the map by the program , the spectrum curve given in Figure 2.1 with Equation 2.2 - 2.3 is automatically obtained.
ICONS
F S = Local ground impact coefficient for the short-period region
F 1 = Local ground impact coefficient for a period of 1.0 seconds
S DS = Short-period design spectral acceleration coefficient [dimensionless]
S D1 = Design spectral acceleration coefficient for a period of 1.0 seconds [dimensionless]
S S = Short period map spectral acceleration coefficient [no dimension]
S 1 = Map spectral acceleration coefficient for a period of 1.0 seconds [dimensionless]
T = Natural vibration period [s]
T A =Horizontal elastic design acceleration spectrum corner period [s]
T B = Horizontal elastic design acceleration spectrum corner period [s]
T L = Transition period to constant displacement region in horizontal elastic design spectrum [s]
S ae (T) = Horizontal elastic design spectral acceleration [ g]
While any of the thrust methods are used within the scope of Assessment and Design Based on Strain, the horizontal elastic design acceleration spectrum defined in Section 2.3.4 of the earthquake effect TBDY is used.
Incremental Response Spectrum Analysis (IRSA Method) As explained in detail under the heading, the thrust analysis method is used, while the horizontal elastic design spectrum defined in TBDY Section 2.3.4 is used and the earthquake load reduction coefficient is not used in the ŞGDT approach.
Next Topic
Related Topics