
Strength According to the design rules, it is the reduction of earthquake loads depending on the ductile behavior of the carrier system. According to the ductility and energy absorption capacity of the structural system types, the R and D coefficients and Ra (T ) earthquake load reduction coefficient are determined in Table 4.1 .
In order to determine these parameters, the results of experimental studies and analytical studies should be evaluated statistically. By performing nonlinear repulsion analysis using element-based strength - displacement curves obtained as a result of the experimental study , a large number of strength-displacement curves obtained for the whole structure are evaluated and Ra (T ) is determined by the R and D coefficients we use in the current regulation .
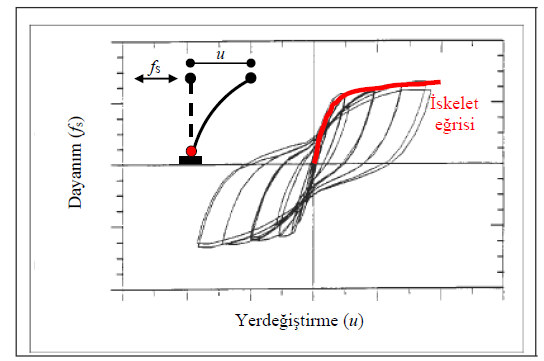
The above curve, which constitutes an example of the curve determined as a result of the experiment, is idealized for analytical work and transformed into a material model. Below is the curve of ideal elasto-plastic material.
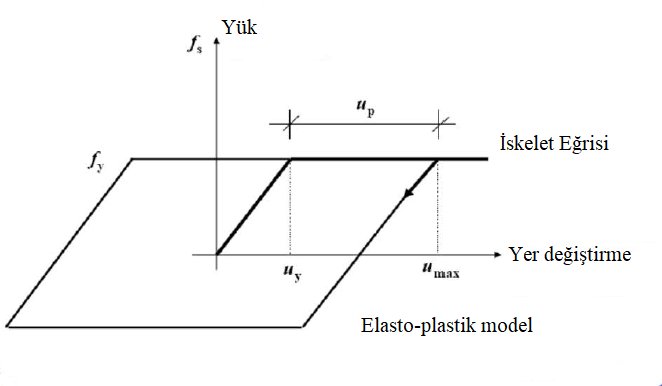
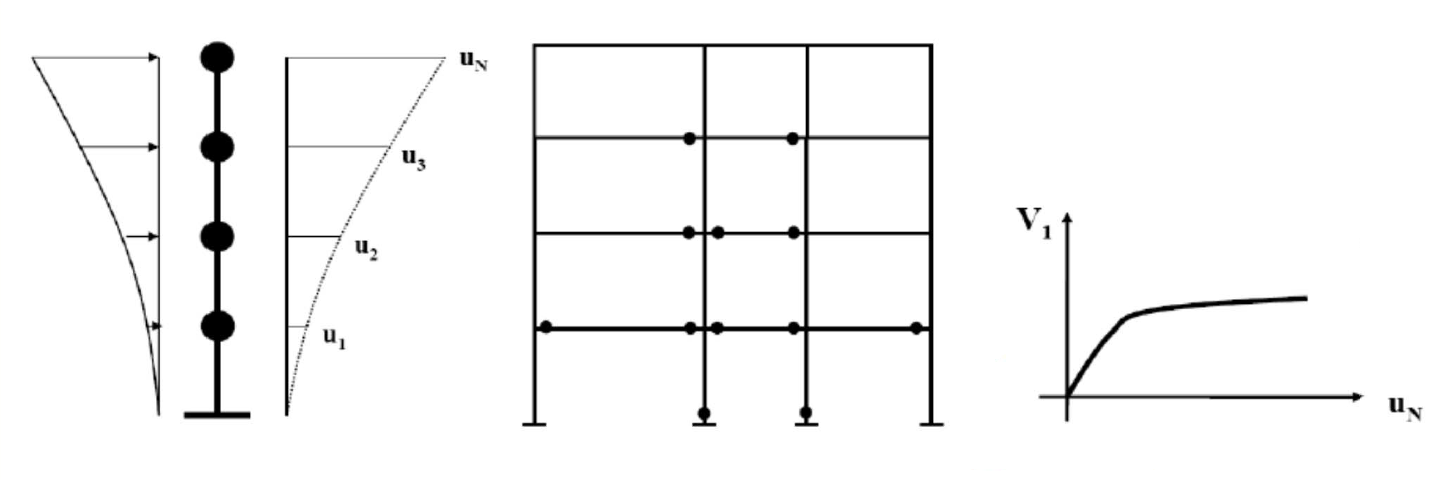
If the nonlinear repulsion analysis of the structure is performed using this material model, the following V t -u n curve is obtained. V t represents the base shear force and u n represents the peak displacement.
Appendix-4A Explanation nonlinear behavior mentioned inAppendix-4A Explanation is converted to a conjugate linear system and the ductility,R and Dcoefficients andRa (T )earthquake load reduction coefficients are determined. The coefficients that we use in the current regulation were obtained by statistically combining many similar studies.
Account Steps
-
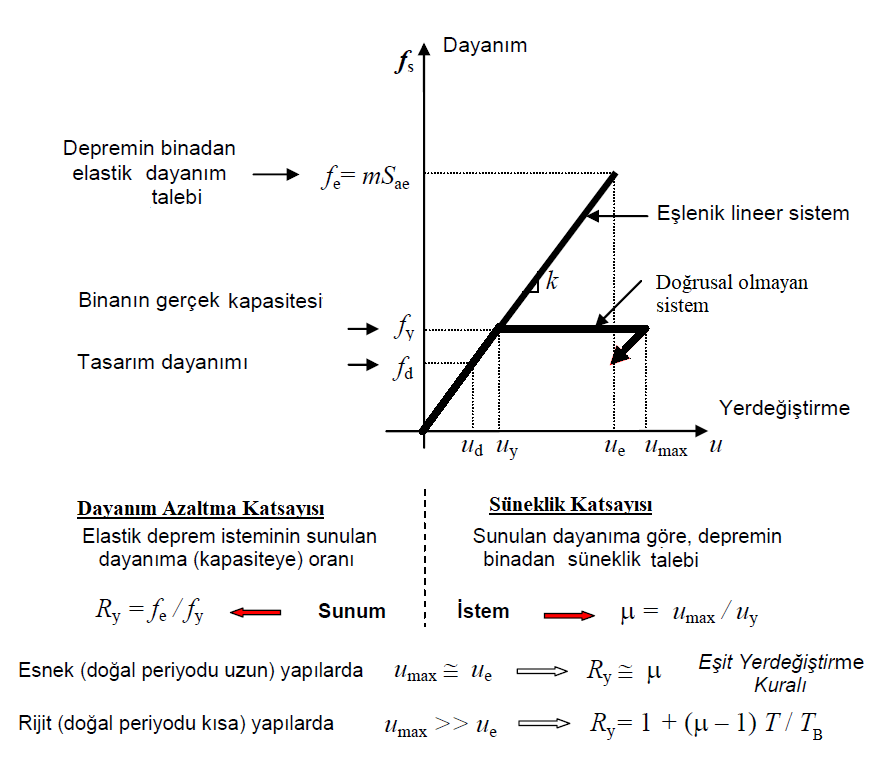
First nonlinear analysis, the push Appendix-4A Explanation made definitions for y , u max , u y , u e is obtained.
-
Based on the rule of equal displacement, the strength f e of the conjugate linear system is determined according to the rule that the area under the curves is equal .
-
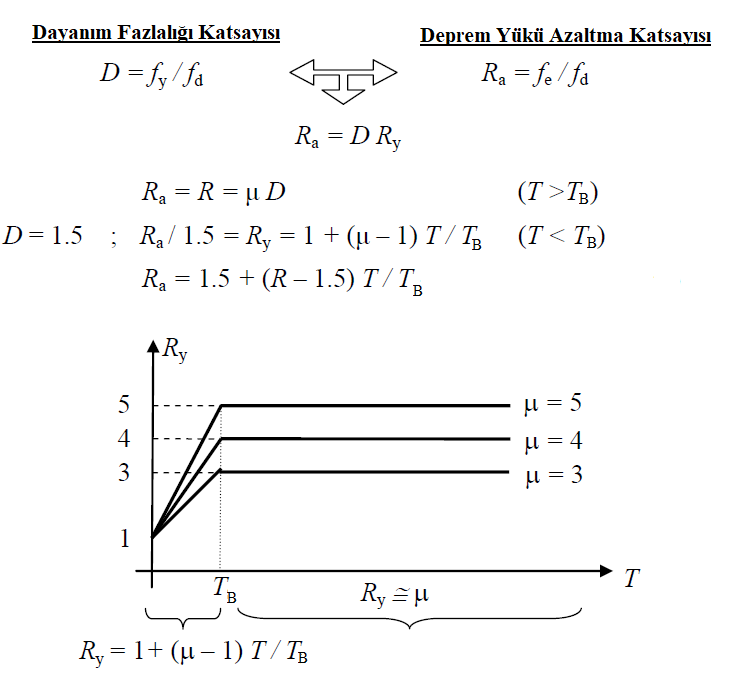
The strength reduction coefficient R y is determined according to the formula in the image.
-
The ductility coefficient μ is calculated according to the formula in the image.
-
If u max approximately equal to u 'to R y and μ must be approximately equal to each other.
-
If u max is greater than ue, the relation between R y and μ ductility is a function.
-
If the design of the structure is carried out with the spectrum specified in the regulation in order to obtain the function , the design strength f d and u d of the structure is obtained with the period T of the structure .
-
If the ductility relation between R y and μ is greater than u max , ue is checked by placing it in the relevant equation.
-
Strength excess coefficient, D is calculated by the relevant formula.
-
The earthquake load reduction coefficient Ra is calculated with the relevant formula.
-
The spectrum corner period T B and T are substituted according to the above formula to determine the range in which Ra fits the formula.
-
The determined R and D values are compared with the regulation values given in Table 4.1.
Related Topics