
Symbols
D = Strength Excess Coefficient
f d (µ, T ) = Design strength required of the carrier system depending on the predicted ductility capacity and period
f (T e ) = Linear (elastic) strength demand calculated for the carrier system
f y (µ k , T ) = Projected ductility capacity and yield strength depending on period
I = Building Importance Factor
R = Structural System Behavior Coefficient
R a ( T ) =Projected ductility capacity and Seismic Load Reduction Coefficient depending on the period
R y (µ k , T) = Predicted ductility capacity and Yield Strength Reduction Coefficient depending on the period
T = Natural vibration period [s]
T B = Horizontal elastic design acceleration spectrum corner period [s]
µ k = ductility capacity prescribed for the carrier system
According to the strength, depending on the ductility capacity-strength demand envisaged for the design, the earthquake load reduction coefficient and the strength excess coefficient are determined. In Design Based on Strength , depending on the predicted ductility capacity , for section design with the bearing strength approach , the design strength f d (µ k , T ) of the carrier system is defined by the following equation:
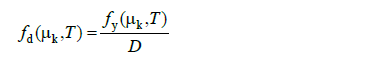
In this equation D , Resistance Redundancy Factor 's is shown. With this coefficient, it is expressed that the yield strength is excessive compared to the design strength.
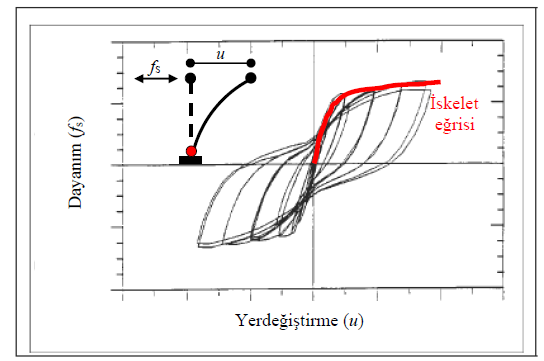
The concept of ductility is mainly determined by the difference between the temporal displacement and permanent displacement regions in the stress-strain curve of the materials. For example, the following curve obtained in the base section as a result of the static cyclic loading test (push - pull) on a reinforced concrete cantilever column shows the typical nonlinear strength-displacement behavior.
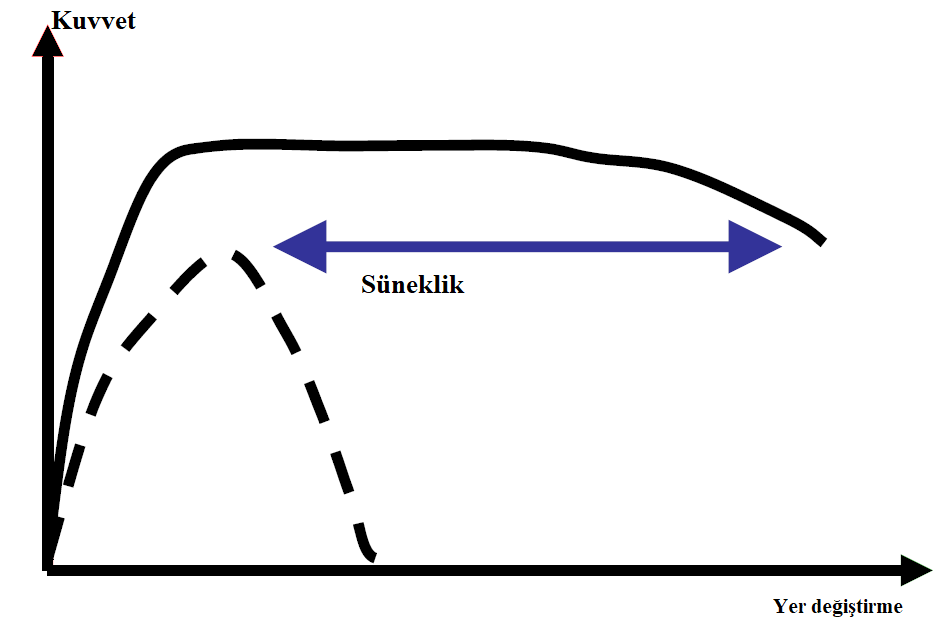
Under the effect of an earthquake, structural elements behave similar to the curve above. In order to design the structure ductile, this displacement capability, which the elements can do, is used. For example, the behavior shown with the dashed line in the figure below represents a building with a brittle design and the continuous line symbolizes the ductile building.
The basis of the calculation method used for Design Based on Strength is the ductile behavior of the carrier system and the reduction of earthquake loads. As you will see in the curve below, the nonlinear behavior of the structure is translated into a conjugate linear system. The assumption is based on the assumption that the area under both curves is equal, that is, the building can absorb equal energy.
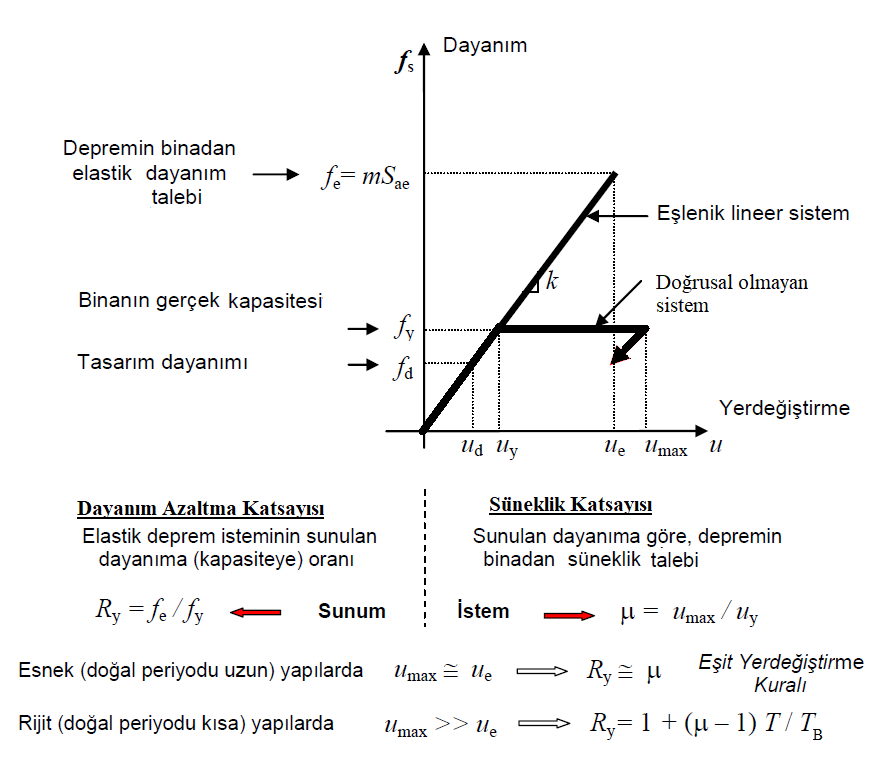
Sae represents the elastic spectral acceleration and m represents the weight of the structure.
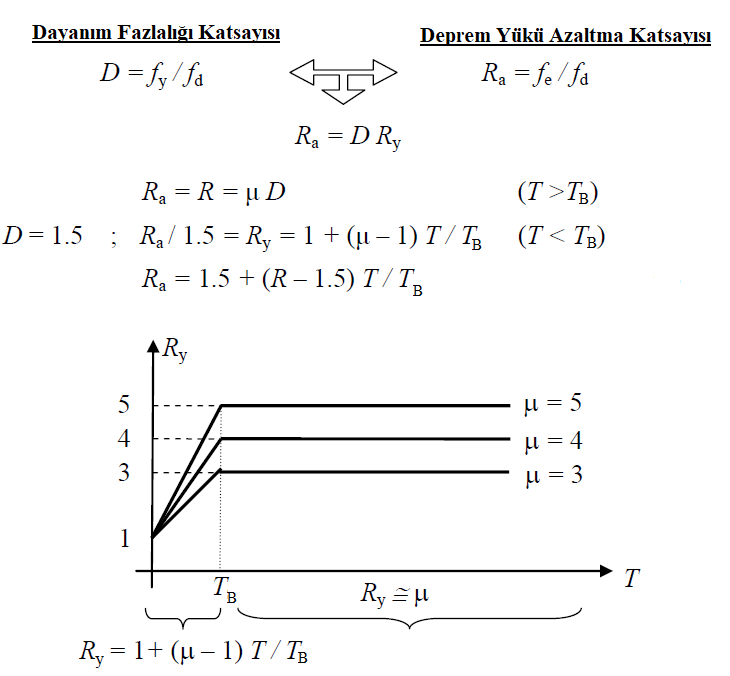
Yield Strength Reduction Coefficient R y (µk, T) , according to the rule of equal displacement
The ductility capacity foreseen for structural systems with low stiffness is taken as equal to µk :
For structural systems with high rigidity, it was taken in TBDY 2018 as follows:
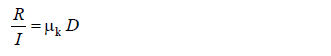
Structural Behavior Coefficient R , predicted ductility capacity μk 'or the defined Resistance Redundancy Factor D reasearch and Building Importance Factor I ' either depending defined:
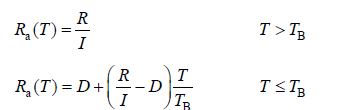
For the section design with the bearing capacity approach in Design Based on Strength , the Earthquake Load Reduction Coefficient Ra (T ) corresponding to a certain fixed ductility capacity selected for each type of structural system is defined as follows ;
As a result, the Earthquake Load Reduction Coefficient R (T a ) is expressed by the following equations to be used in practice :
Next Topic
Related Topics