
-
The building carrier system is modeled in three dimensions.
-
Earthquake effects in two horizontal directions perpendicular to each other are automatically determined.
-
Linear damping ratio is automatically chosen 5%. The damping rate can be changed depending on the user control.
-
The second order effects caused by the axial forces in the deformed carrier system are determined automatically.
-
The material strengths are determined according to the expected (average) material strengths specified in Table 5.1, and the effective yield moments are determined automatically using the fiber solution according to these material strengths.
ICONS
f ce = Average (expected) compressive strength ofconcrete
f ck = Characteristic compressive strength of concrete
f co = Compressive strength of unconfined concrete
f ye = Average (expected) yield strength ofreinforcement steel
f yk = Characteristic yield strength ofreinforcement steel
f sy = yield strength of reinforcement steel
G = Constant load effect
Q = Live load effect
E Earthquake effect in the direction of d (X) = (X)
Earthquake effect in the direction of E d (Y) = (Y)
E d (Z) = Vertical earthquake effect
Building carrier system is modeled in three dimensions according to the Article 5.4.1.1 of TBDY . Analysis model is created automatically when any structural element (column, beam, curtain, floor) is entered. Modeling a building element in three dimensions means considering all degrees of freedom of that element in the stiffness matrix. How to automatically define an element's three-dimensional degree of freedom in Element Local Axes and Local Axes of Shell Elements It is explained in detail.
There are 6 freedoms in total, 3 translation vectors and 3 rotation vectors at one end of the frame elements. In this case, for a 3-dimensional analysis, a node must have 6 deformation results.
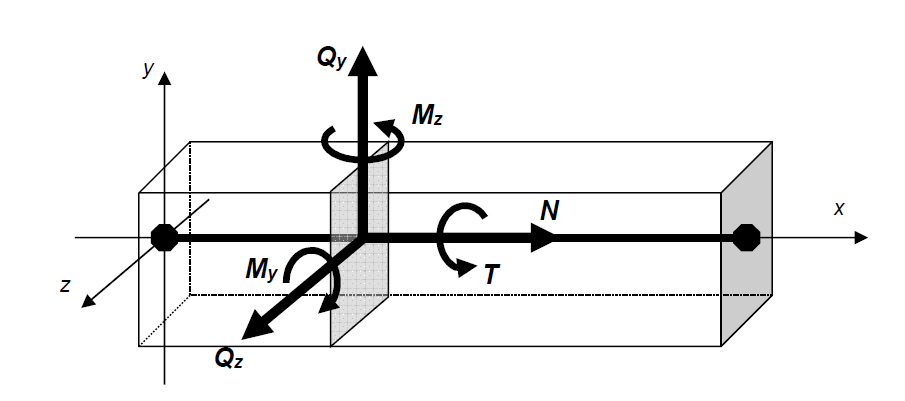
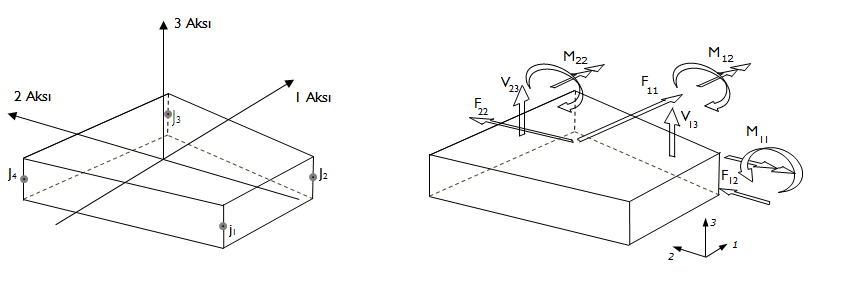
Similarly, there are a total of 6 freedoms, 3 translation vectors and 3 rotation vectors, at the nodes of the shell elements. However, while creating internal force diagrams in frame elements, stress results occur in shell elements.
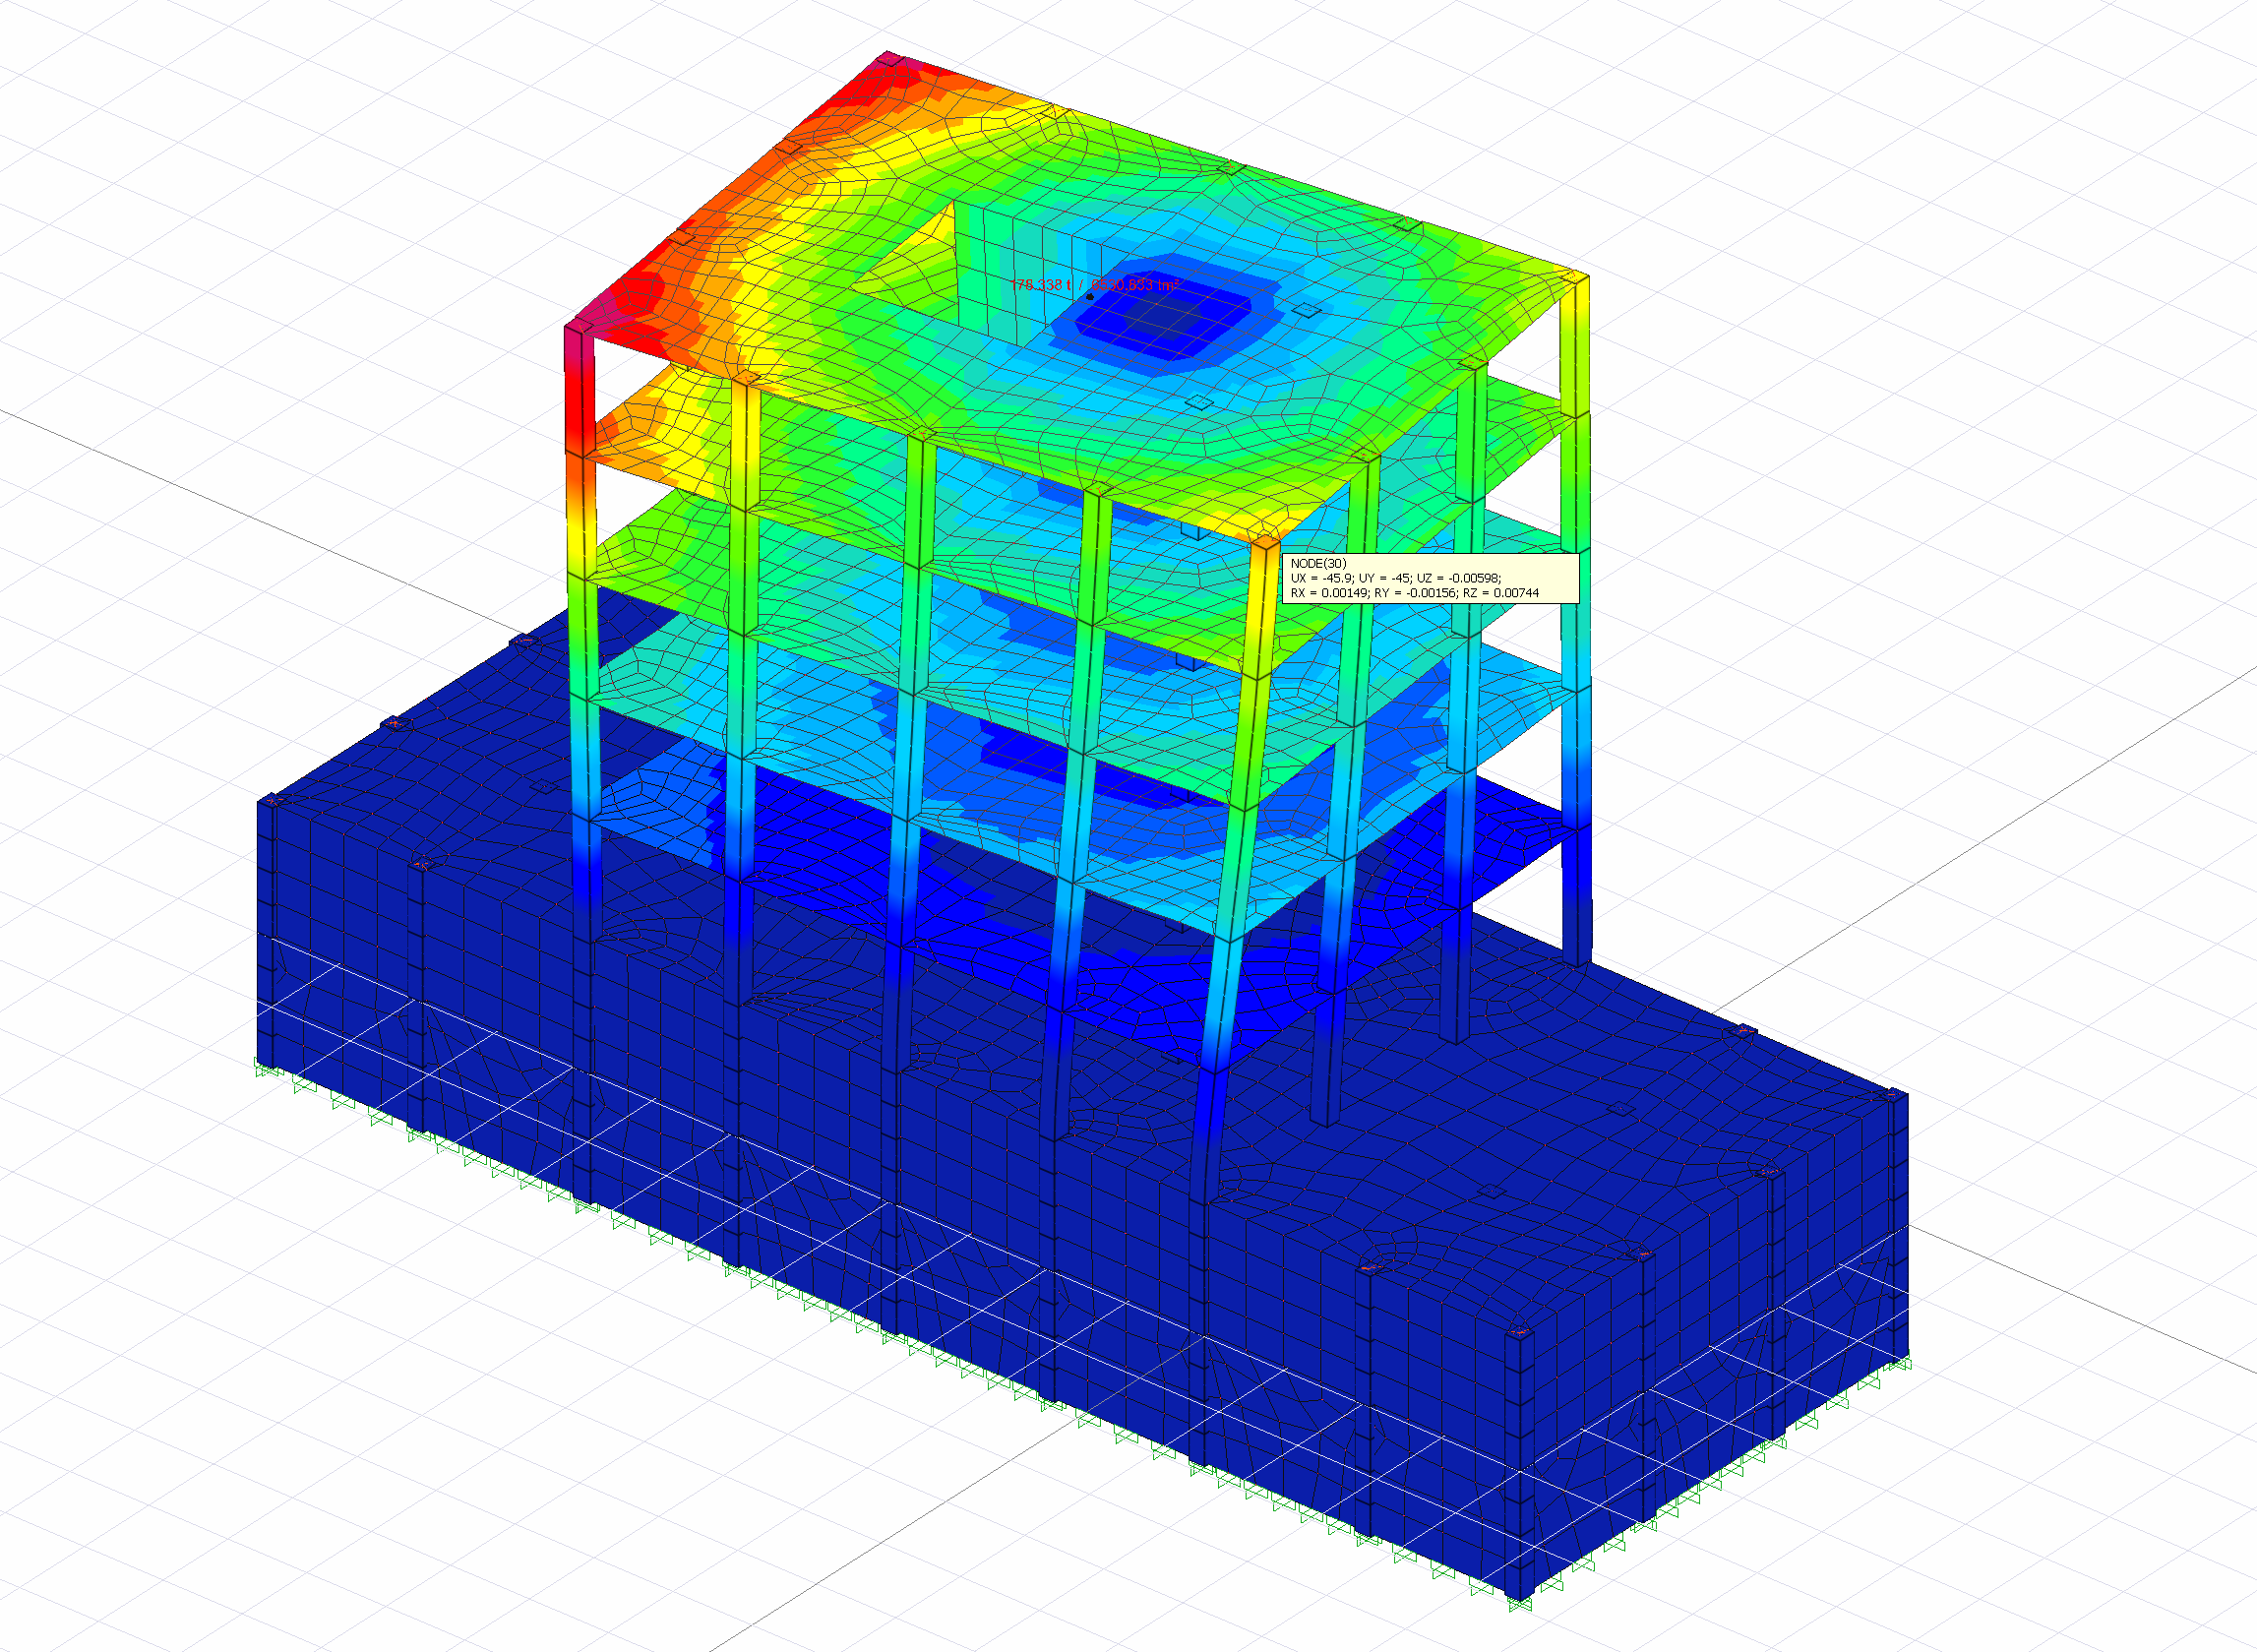
In the picture below, an analysis model and deformation shape of a sample structure modeled in 3D can be seen. As you can see, each node has 6 displacement values, 3 of which are translation and 3 rotations.
Basic Combinations with Seismic Load Effects
G + 0.3Q + E d (X) + 0.3E d (Y) + 0.3E d (Z) G + 0.3Q + E d (Y) + 0.3E d (X) + 0.3E d (Z)
G + 0.3Q + E d (X) -0.3E d (Y) + 0.3E d (Z) G + 0.3Q + E d (Y) -0.3E d (X) + 0.3E d (Z)
G + 0.3QE d (X) + 0.3E d (Y) + 0.3E d (Z) G + 0.3QE d (Y) + 0.3E d (X) + 0.3E d (Z)
G + 0.3QE d (X) -0.3E d (Y) + 0.3E d (Z) G + 0.3QE d (Y) -0.3E d (X) + 0.3E d (Z)
The damping rate for single mode and multimode propulsion methods was chosen as 5% in accordance with TBDY Article 5.4.1.3 .
Basic Combinations with Seismic Load Effects for Nonlinear Analysis will be made. This analysis is a nonlinear analysis in terms of geometry and the second order effects p-δ and p-Δ created by the axial forces in the deformed carrier system are taken into account. Due to the second order effects p-δ and p-Δ, additional internal forces occur in the carrier system.
Concentrated Plasticity Model Stress-Strain Curves for Concrete and Reinforcement Materials
According to Article 5.4.1.5 (b) of TBDY, in the ŞGDT approach of new buildings, the material strength of concrete and reinforcement steel is based on the expected (average) strengths defined in Table 5.1 of the TBDK .
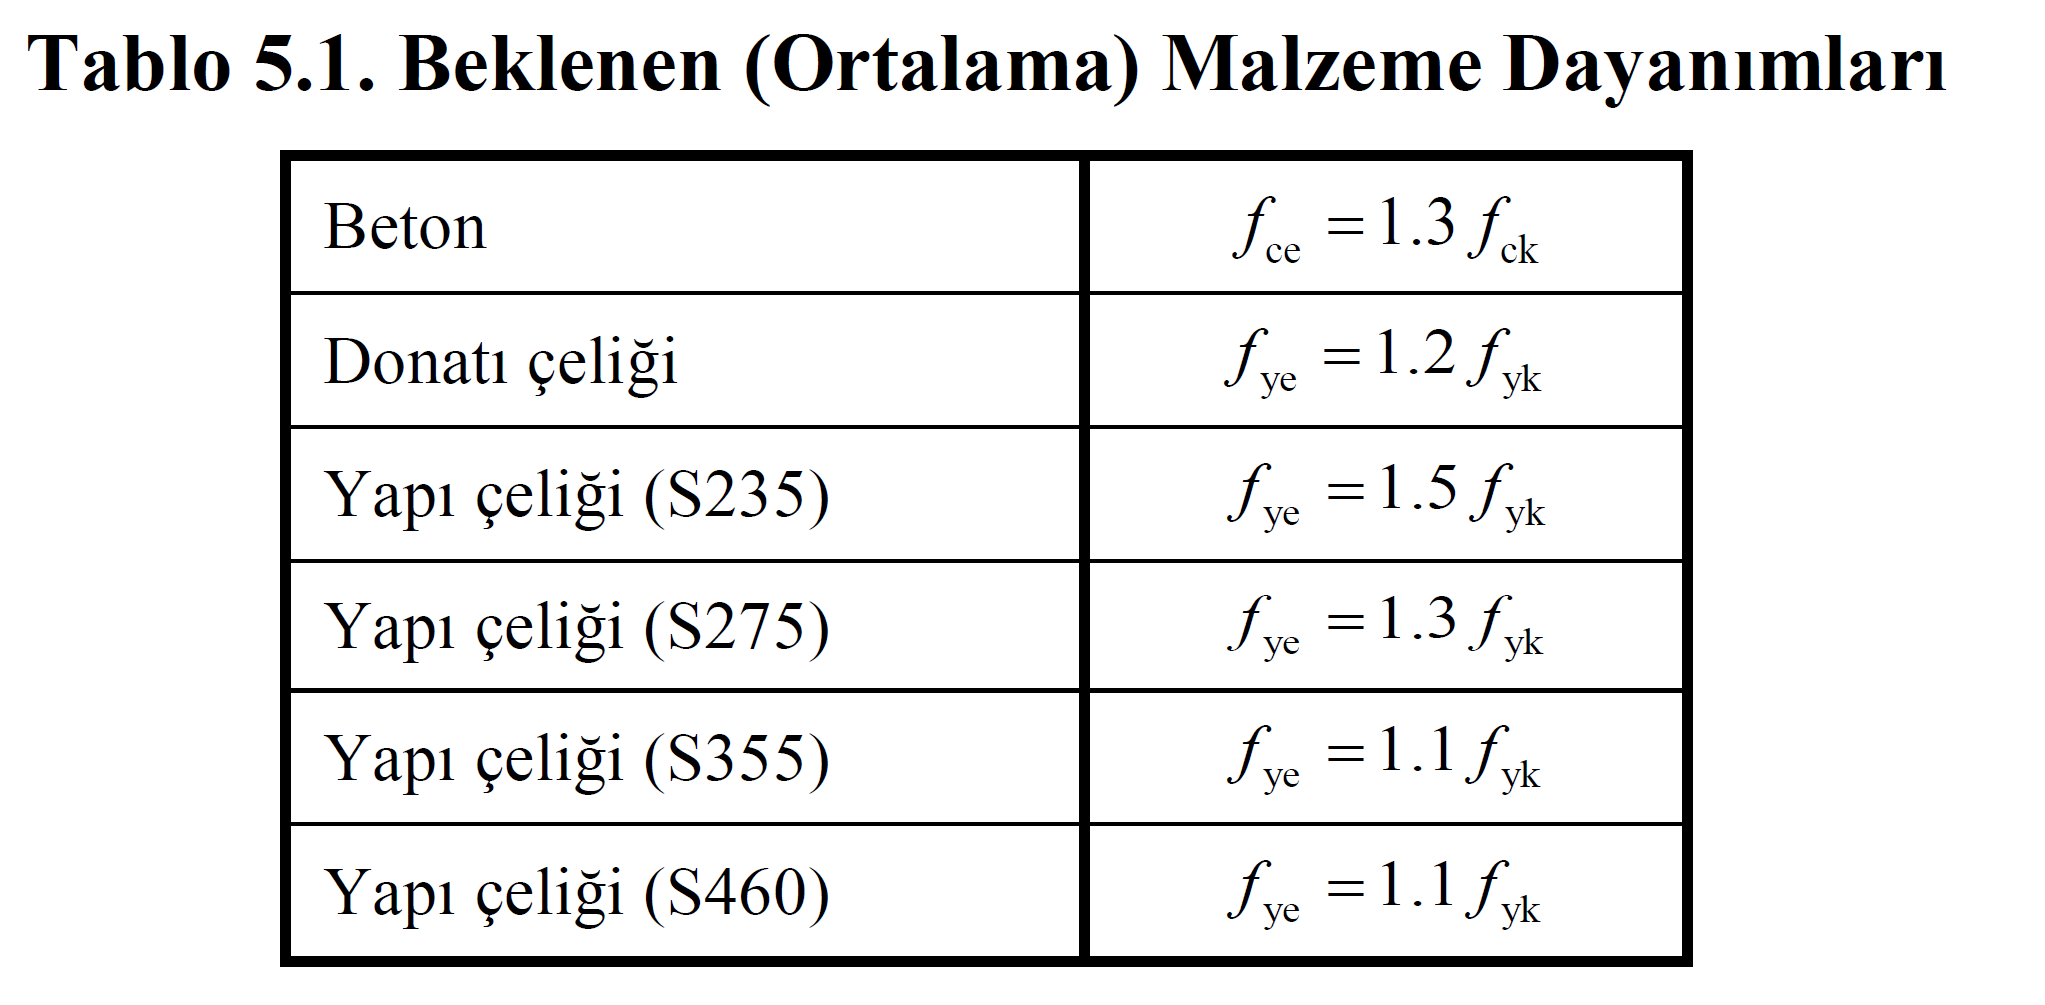
While the expected (average) strengths are used as the material model, in the material models defined in TBDY Part Annex 5A (Stress-Strain Curves for Concrete and Reinforcement Materials )is equal toconcrete compressive strength fco, concrete expected (average) compressive strength fce= 1.3fck. Similarly reinforcement steel yield strength, fsy, reinforcement expected (average) yield strength forye= 1.2fykis equal to the value.
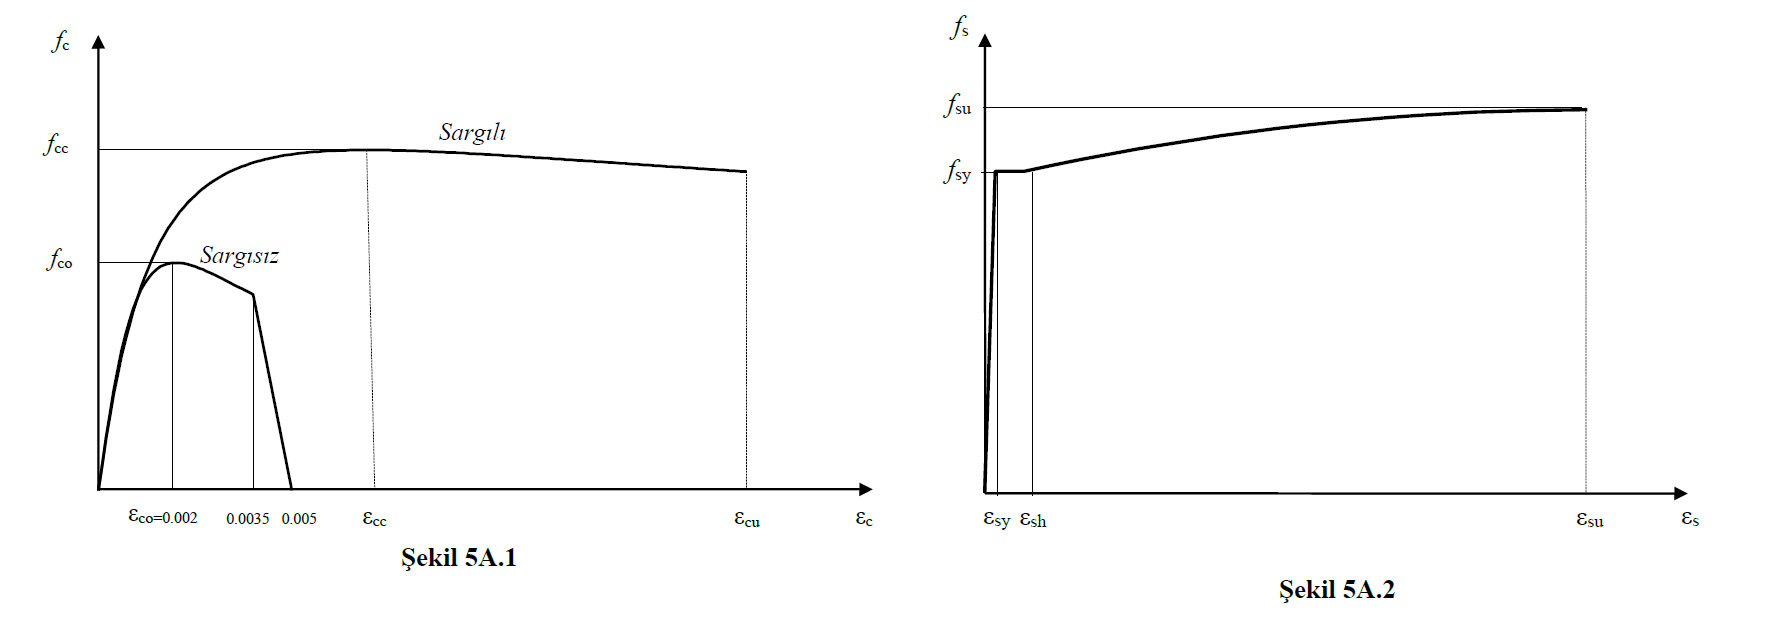
In the figure above, TBDY is shown in Figure 5A.1 for wrapped and uncoated concrete, and TBDY is shown in Figure 5A.2 for reinforcement steel material models. The moment-curvature relation used when defining plastic hinges is created according to these material models ( Stress-Strain Curves for Concrete and Reinforcement Materials).
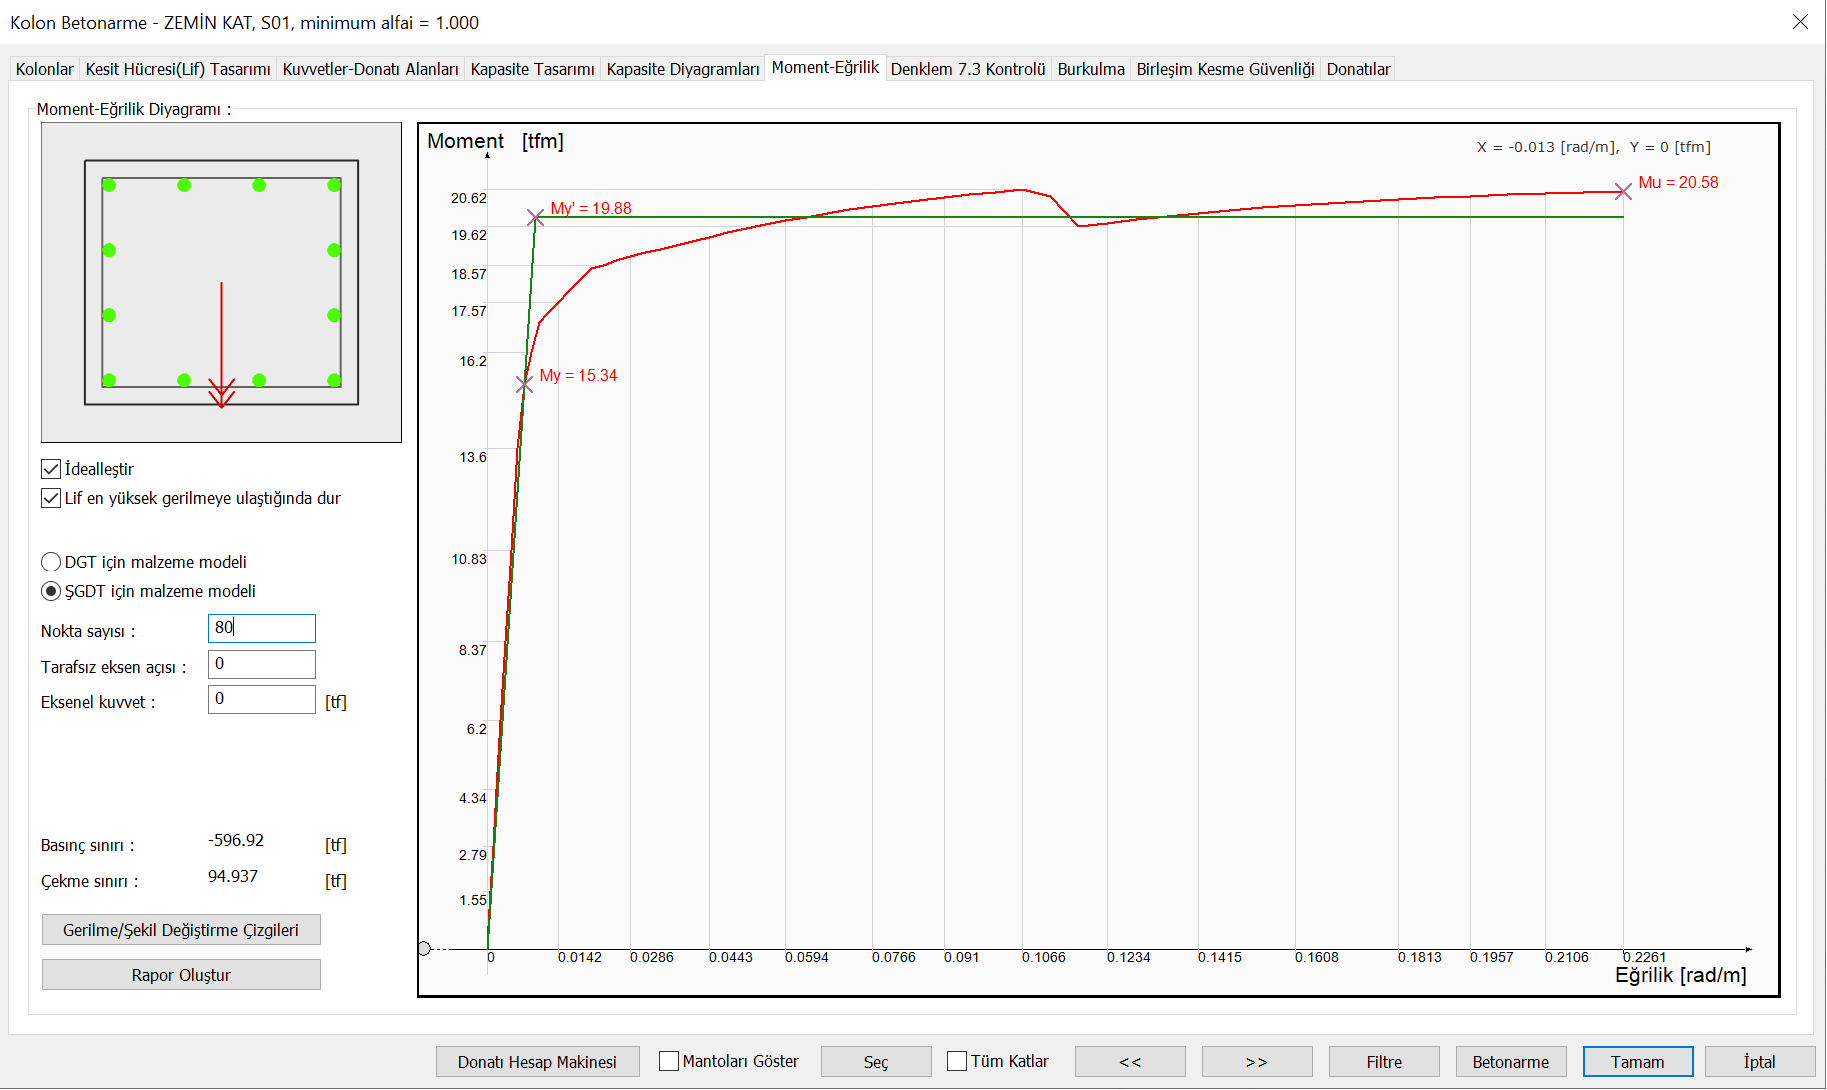
In the picture below, there is a moment-curvature relationship and an idealized graph created by using the expected (average) strengths for an element of a new building . After the concrete and reinforcement material are selected, moment-curvature analysis is performed automatically according to the positions of the reinforcement and plastic joints are created automatically.
Next Topic
Related Topics