
-
Using the Horizontal Elastic Design Spectrum , the performance point is automatically calculated for each mode and direction.
Incremental Spectrum Analysis (ARSA) method is a displacement-controlled pushover analysis method. In the method, the modal displacement increments are scaled according to the nonlinear spectral displacement value obtained according to the instantaneous dynamic characteristics of the structure. The basis of modal scaling in the ARSA method is based on the "equal displacement rule". According to this rule, assuming that nonlinear spectral displacement is equal to elastic spectral displacement, modal displacement increments are expressed as ratios of elastic spectral displacements of that mode. Therefore, in the first repulsion step (linear elastic case), the elastic spectral displacement of the nth mode will be calculated from S den (1) and the same value will be used in all other steps (i = 2,3….).
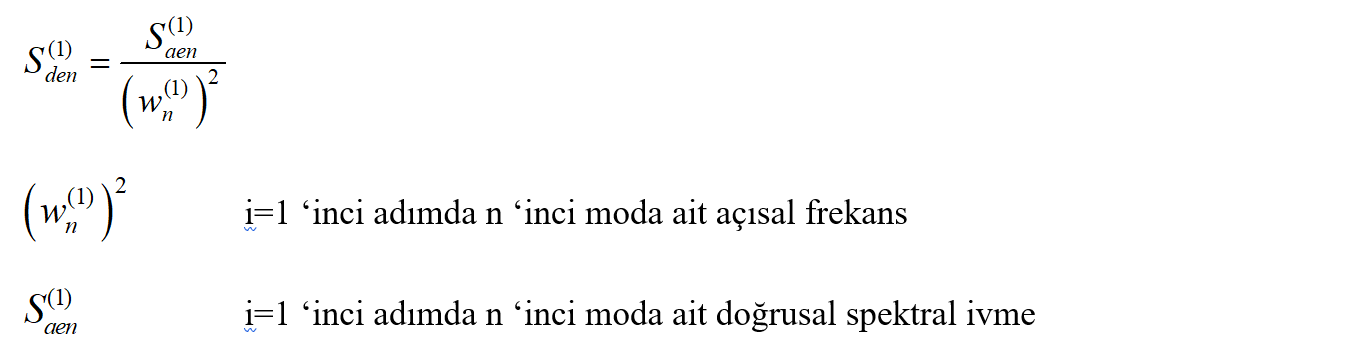
Spectral displacement is calculated from S (1) only in the first step, and this value is used in all steps of the impulse analysis. Spectral displacement S from (1) value TBDY Section 2.3.4 as defined in horizontal elastic design spectrum is found using. S in the term from S to (1) also means spectral displacement. The index "n" in this term indicates the mode in which mode and the index (1) indicates the step in which operation is performed. Thus S from (1)It is the spectral displacement calculated for the n th mode in the 1st push step. This value is calculated for all vibration modes calculated in the first step of the building as follows. The value of (1) from S is calculated by the following formula.
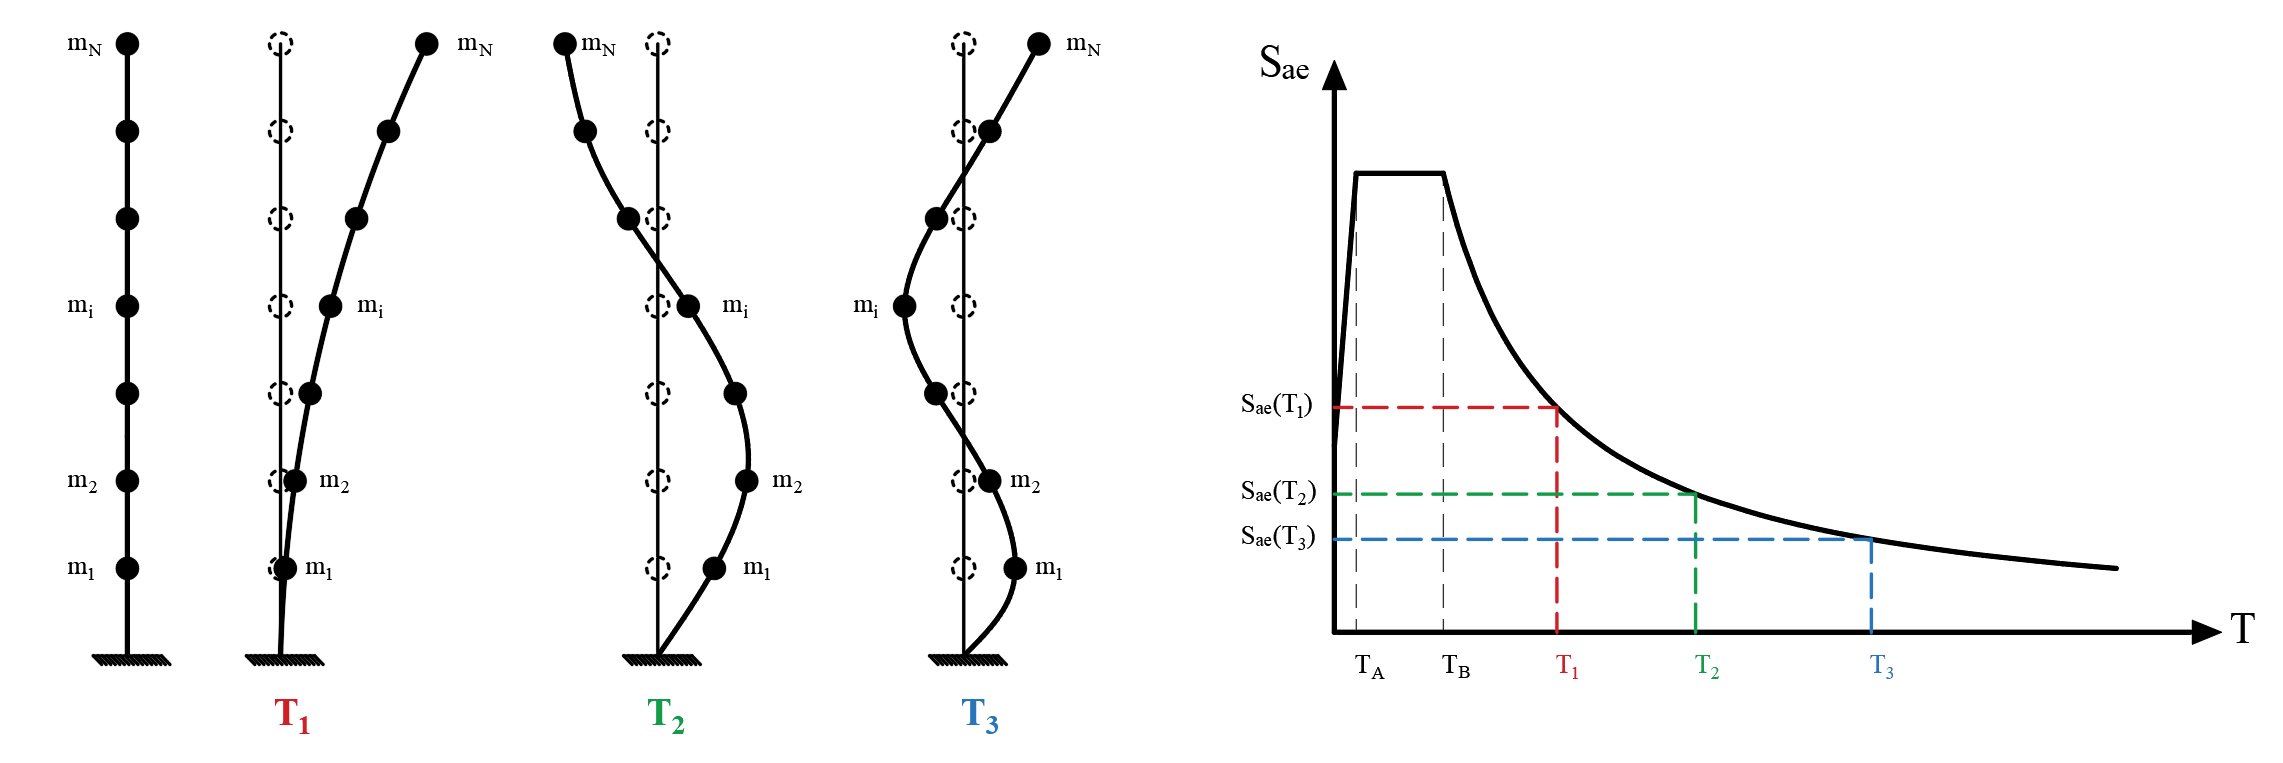
The value of S aen (1) is the spectral acceleration value found for each vibration mode using Horizontal Design Response Spectrum . The figure below shows how the values of S aen (1) are found for 3 modes (n = 1, n = 2 and n = 3 for the third mode) as a representation. The S ae values, which are the equivalents of the periods obtained from the modal analysis results from the first impulse step in the horizontal elastic design spectrum, are found. In the term S aen (1), the index "n" indicates the mode in which and the index (1) indicates the step in which step is processed. The term S ae turns into the term S aen (1) in the ARSA method .
Since the modal analysis is performed in three dimensional carrier systems, all the above procedures are applied for earthquakes in (X) and (Y) directions.
ω The term n (1) is the angular frequency at the i = 1'th step and belonging to the n'th mode. These values are found for each mode as a result of the modal analysis.
After finding S aen (1) and ω n (1) for each n th vibration mode , it can be found from S (1) as explained above. This step is done only in the first step (i = 1) of the ARSA method push analysis. In all other steps (i = 2,3,4… .. ) the value of S aen (1) calculated in the first step is used.
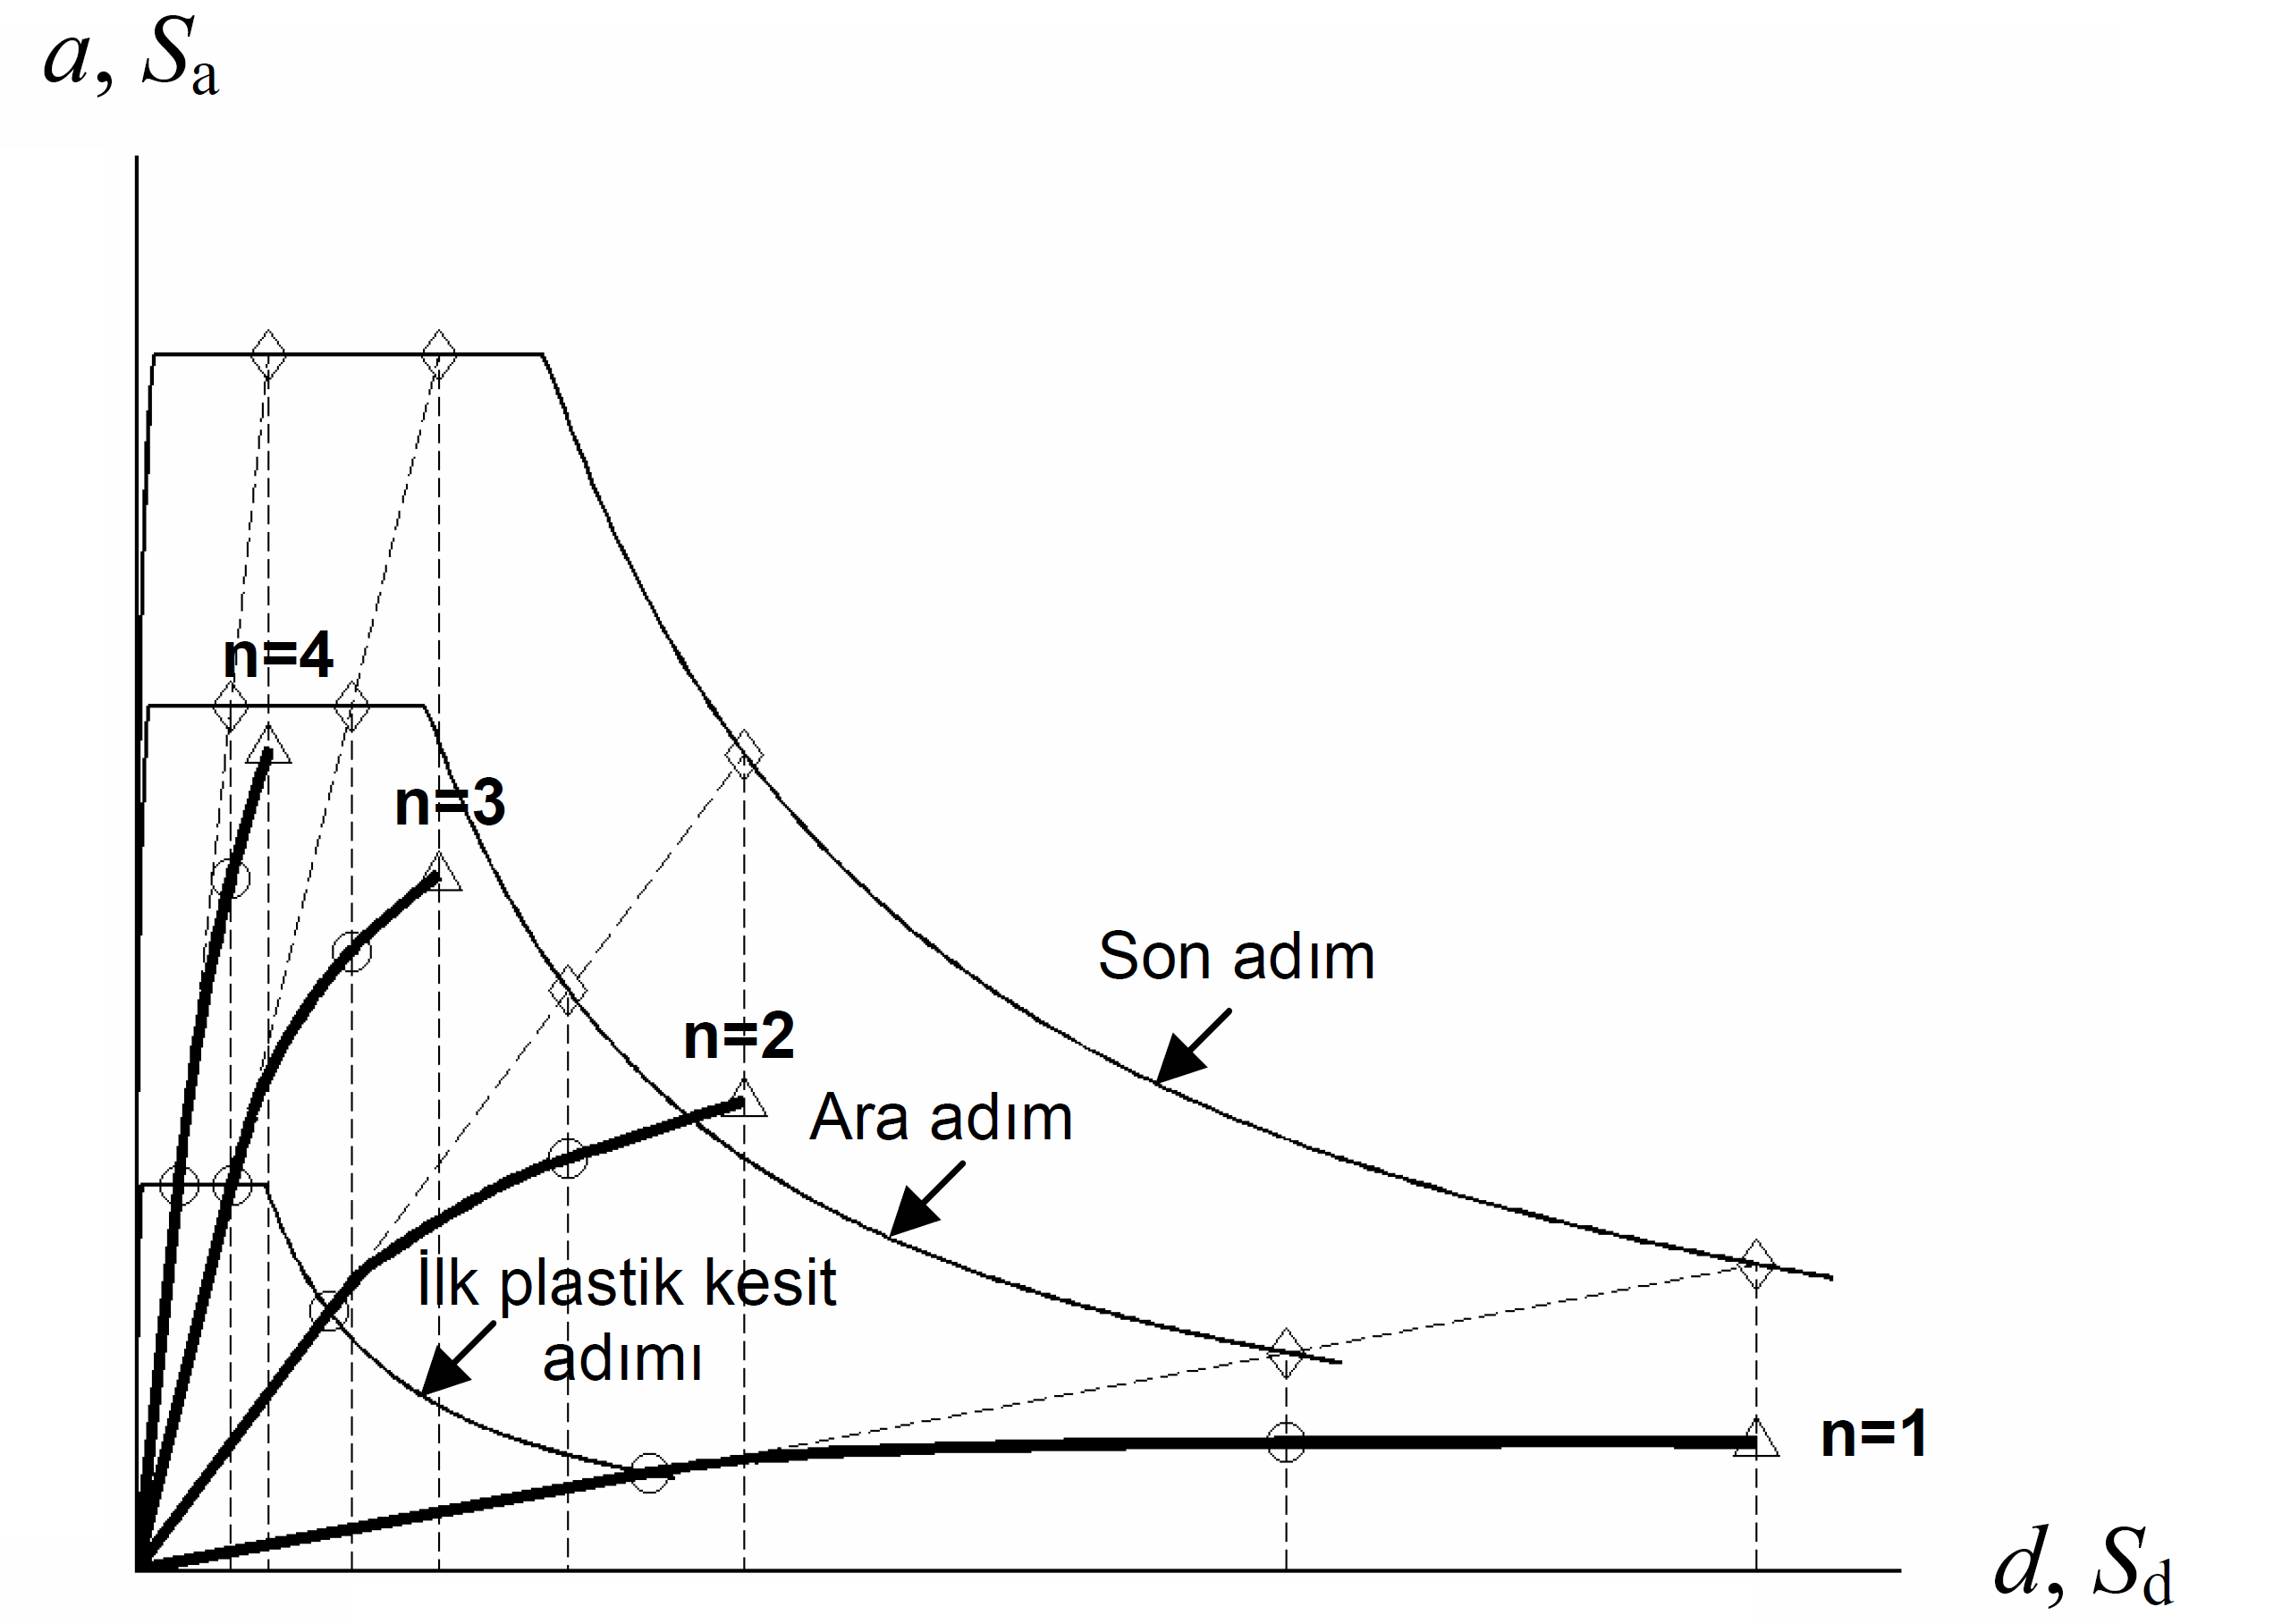
The basis of modal scaling in the ARSA method is based on the "equal displacement rule". According to this rule, assuming that nonlinear spectral displacement is equal to elastic spectral displacement, modal displacement increments are expressed as ratios of elastic spectral displacements of that mode. The scaled state of the response spectrum drawn in the coordinates of "spectral displacement (S d ) - spectral acceleration (S a )" at the end of the linear elastic first step where the first plastic section in the system is formed and the scaled state at the end of any subsequent i'th intermediate step. It is seen in the same way. In the last repulsion step, according to the rule of equal displacement, the elastic behavior spectrum itself is reached.
The graph of the performance point calculation in the pushover analysis of the "equal displacement rule" with ARSA method is shown in the figure below. The line drawn in blue expresses the Elastic Response Spectrum . The ones drawn in red are the " Modal displacement (d) - modal acceleration (a) " coordinates and the thrust curves calculated for each mode. Modal displacement (d) value on the horizontal axis of the point where the line continuing with the initial stiffness intersects the Elastic Response Spectrum in the repulsion curves drawn for each mode, indicates the performance point and is shown with (PN). The performance point is determined using the Elastic Response Spectrum . S aen for each nth vibration modeAfter finding (1) and ω n (1) , it is calculated from S (1) and thus elastic spectral displacements of that mode are calculated. This value is the largest displacement the system can make in the elastic state. According to the equal displacement rule, the elastic spectral displacement of that mode is equal to the nonlinear displacement of that mode. In this way, the performance point is determined for each nth vibration mode.
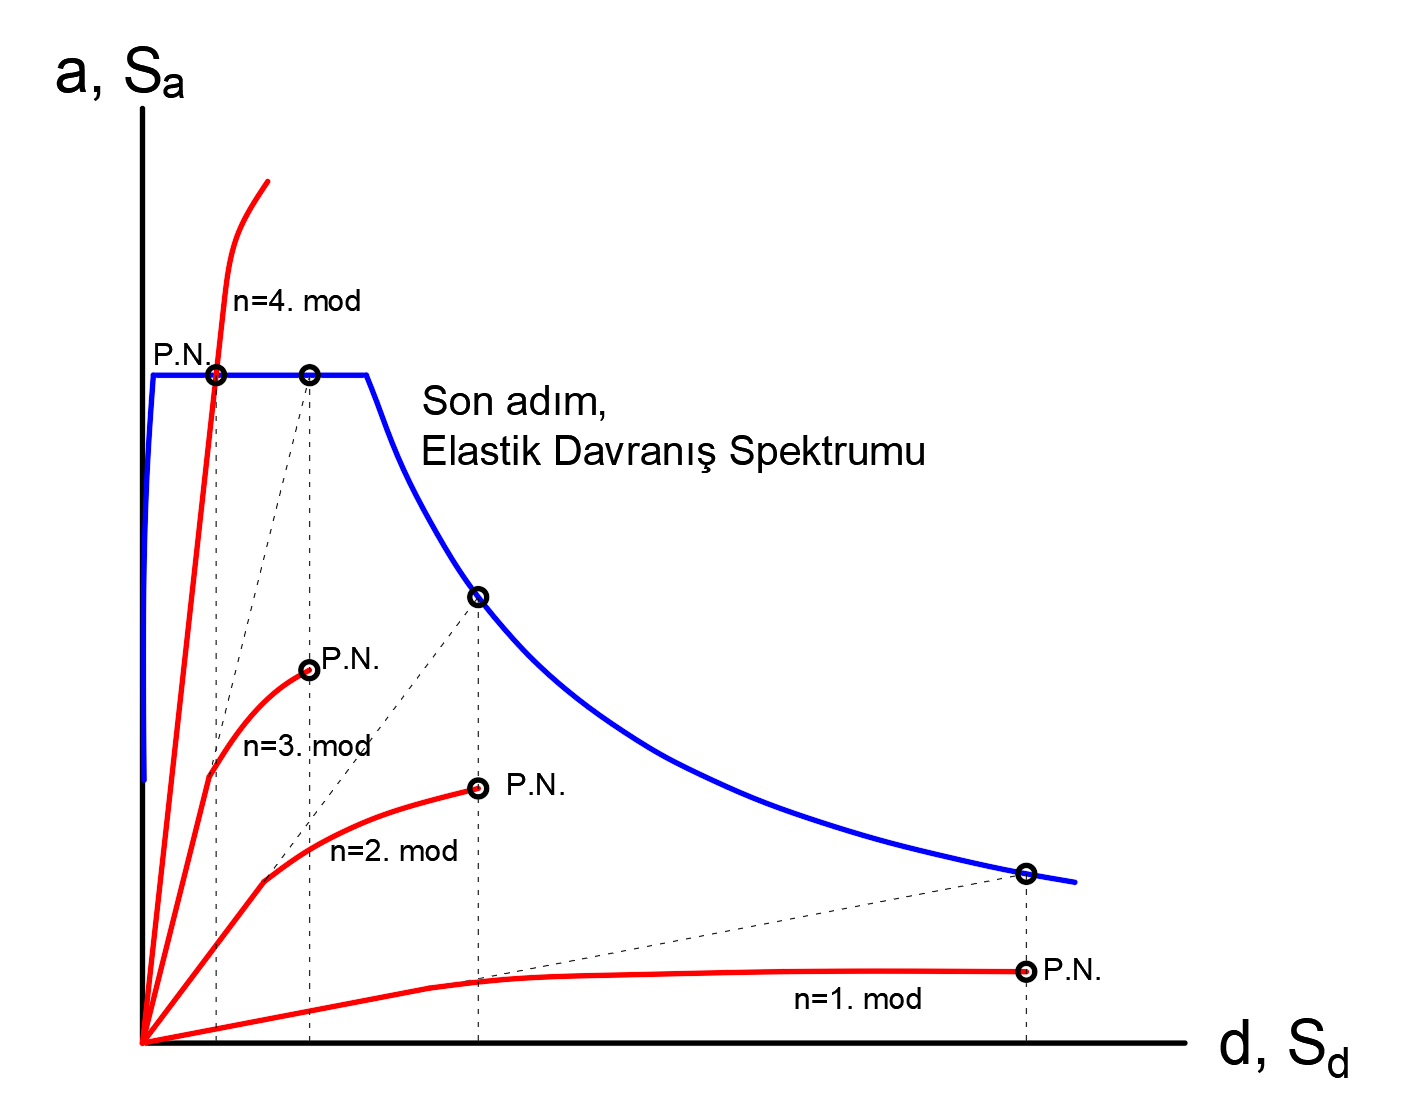
As in the picture above any n-th initial curve of the jitter mode Elastic Response Spectrum 's if the pouch, said mode performance point of Elastic Response Spectrum ' is the point where the cut. In this case, there is no mention of a nonlinear behavior for the n'th vibration mode because the n'th vibration mode remains within the elastic boundaries. The contribution of the modes in which the n th vibration mode cuts the initial stiffness Elastic Response Spectrum is not considered after reaching the performance point.