
-
For Site Class ZF, a site-specific ground motion spectrum can be user-defined by entering the values of SS, S1, FS, and F1. Once these parameters are entered, the program automatically generates the corresponding spectrum curve for the ZF site class.
-
A site-specific ground motion spectrum for Site Class ZF can be user-defined. A function consisting of period (T) and the corresponding reduced design spectral acceleration values, SaR(T), can be imported into ideCAD Statik as a
.txtfile.
ICONS
T = Natural vibration period [s]
TA = Horizontal elastic design acceleration spectrum corner period [s]
TB = Horizontal elastic design acceleration spectrum corner period [s]
FS = Local ground impact coefficient for the short-period region
F1 = Local ground impact coefficient for a period of 1.0 seconds
SDS = Short-period design spectral acceleration coefficient [dimensionless]
SD1 = Design spectral acceleration coefficient for a period of 1.0 seconds [dimensionless]
SS = Short period map spectral acceleration coefficient [dimensionless]
S1 = Map spectral acceleration coefficient for a period of 1.0 seconds [dimensionless]
Sae (T ) = Horizontal elastic design spectral acceleration [g]
SaR (T ) = Reduced design spectral acceleration [g]
D = Excess Strength Factor
I = Building Importance Factor
R = Structural System Behavior Factor
R a (T) = Earthquake Load Reduction Factor depending on the anticipated ductility capacity and period
λ = Empirical coefficient used in limiting relative story drifts
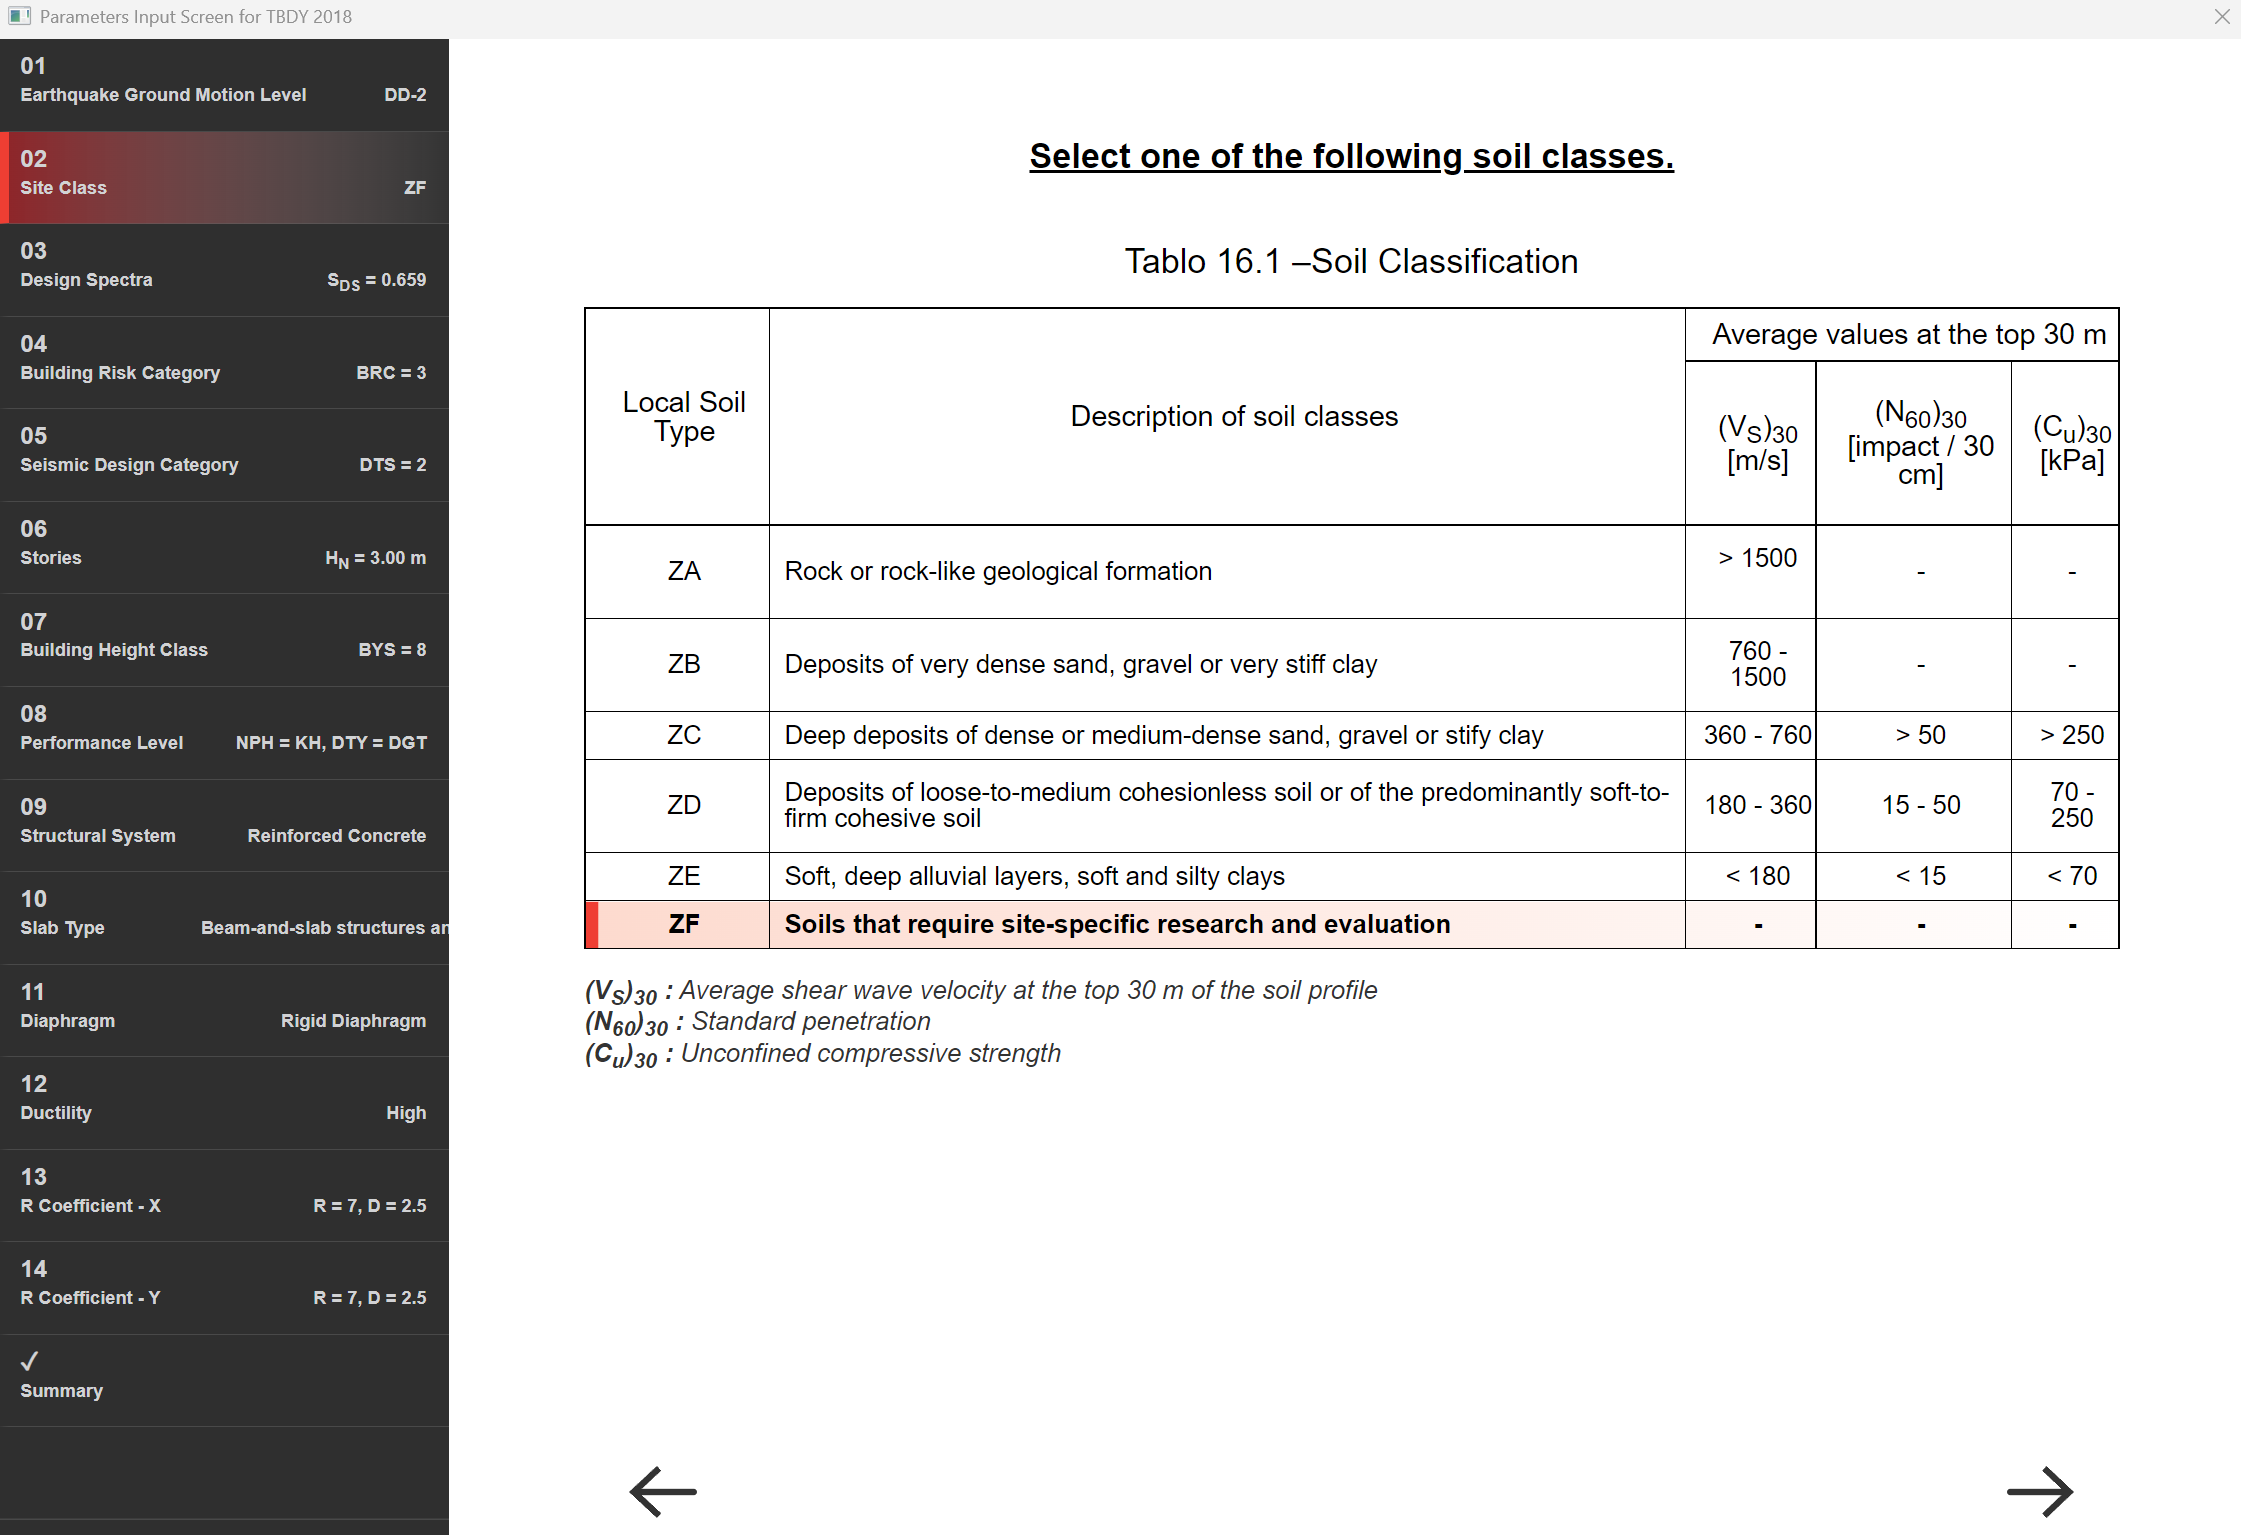
The site-specific ground motion spectrum for Site Class ZF can be defined in two distinct ways.
-
A response spectrum curve can be generated by specifying the parameters SS, S1, FS, and F1.
-
Alternatively, a user-defined spectrum can be imported into the program by uploading a
.txtfile.
The response spectrum curve is generated by specifying the parameters SS, S1, FS, and F1.
-
To enable this spectrum, select the ZF local site class from the Analysis Settings Wizard.
-
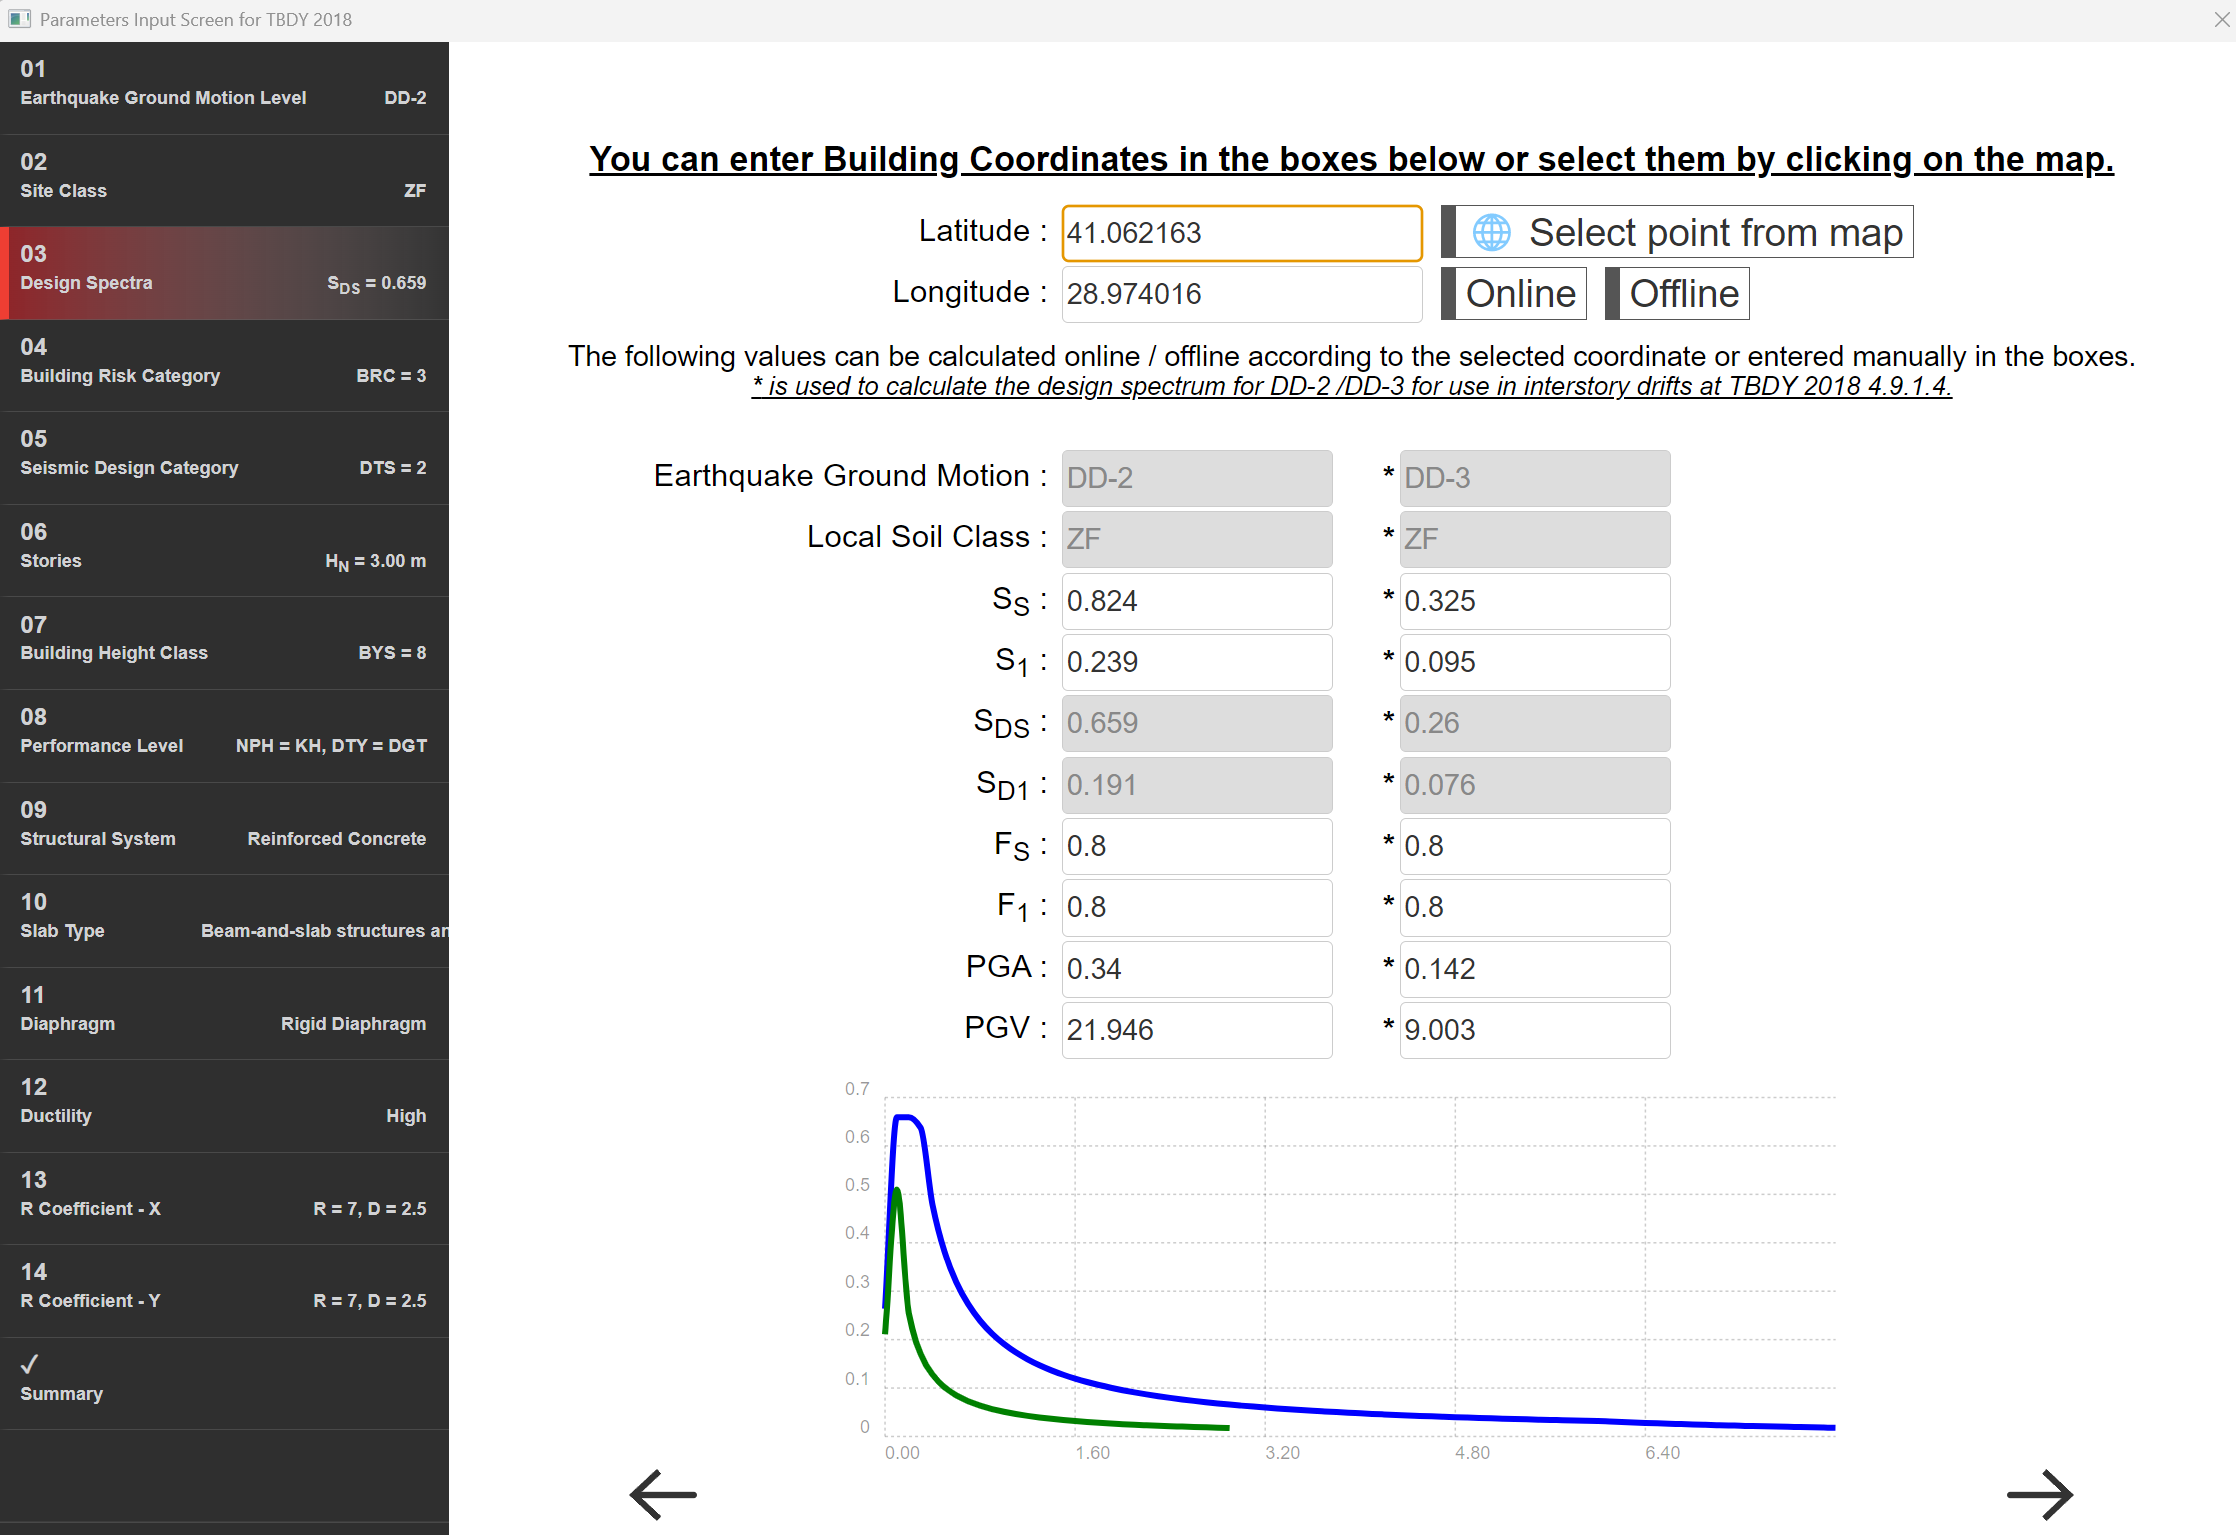
The map spectral acceleration coefficients, SS and S1, along with the site-specific amplification factors, FS and F1, are defined.
-
The FS and F1 values must be defined by the user in accordance with the ZF local site class.
-
The remaining steps in the Analysis Settings Wizard are followed to generate the response spectrum curve.
-
First, the Ra values are calculated using Equations 4.1a and 4.1b of TBDY 2018, based on the period (T) and elastic design spectrum acceleration (Sae) values obtained from the site-specific ground motion study. Then, in accordance with Equation 4.8 of TBDY 2018, each Sae value is divided by the corresponding Ra value. By following this procedure, the Elastic Design Spectrum to be defined in the software is obtained.
-
Export the resulting design spectrum as a
.txtfile containing the corresponding period (T) and acceleration (SaR) values. Ensure that all decimal numbers in the.txtfile are written using a dot (.) as the decimal separator. -
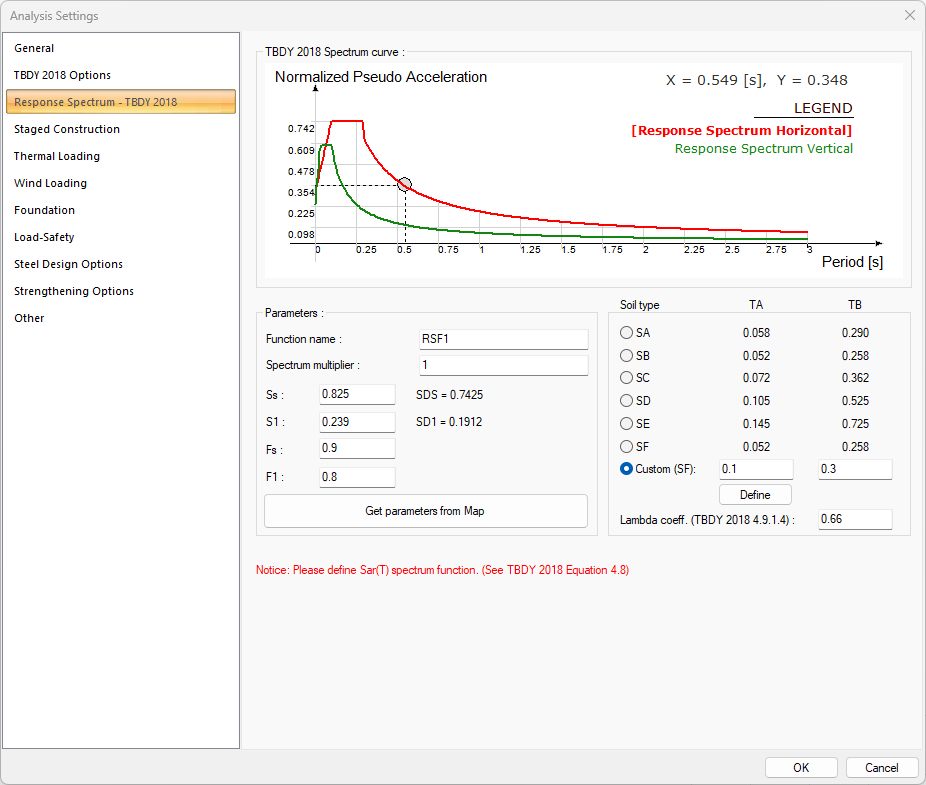
Open the Analysis Settings dialog.
-
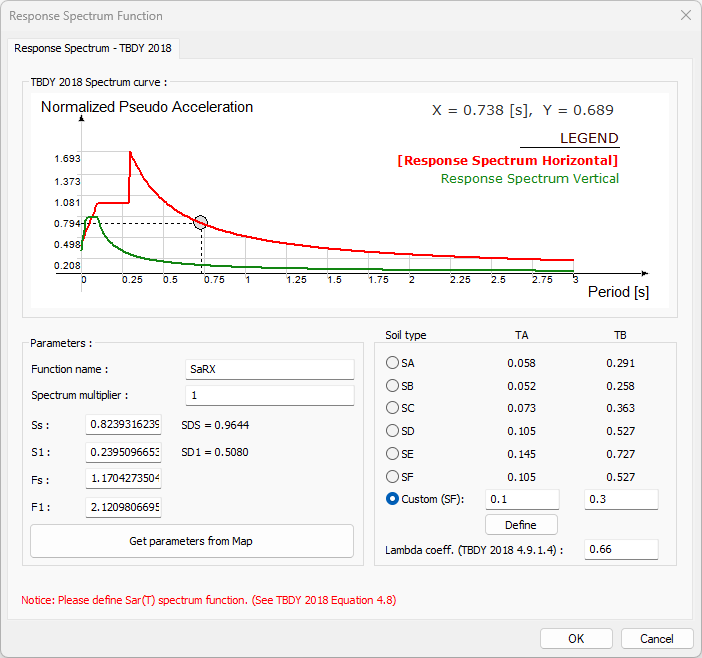
Go to the Response Spectrum - TBDY 2018 tab.
-
Click the box labeled “Custom (SF)”.
-
Pay attention to the prompt requesting you to define the SaR(T) spectrum.
The design spectrum to be defined must be a processed spectrum in accordance with TBDY 2018 – Equation 4.8, incorporating the effects of the R (response modification coefficient), I (importance factor), and D (ductility factor or system behavior coefficient) values.
-
Click the "Define" checkbox.
As a secondary prompt, pay attention to the warning that advises verifying the accuracy of the R, I, and D values in the Analysis Settings options.
These parameters are critical, as they are used in seismic code checks such as relative displacement, second-order effects, and other requirements specified in the earthquake code.
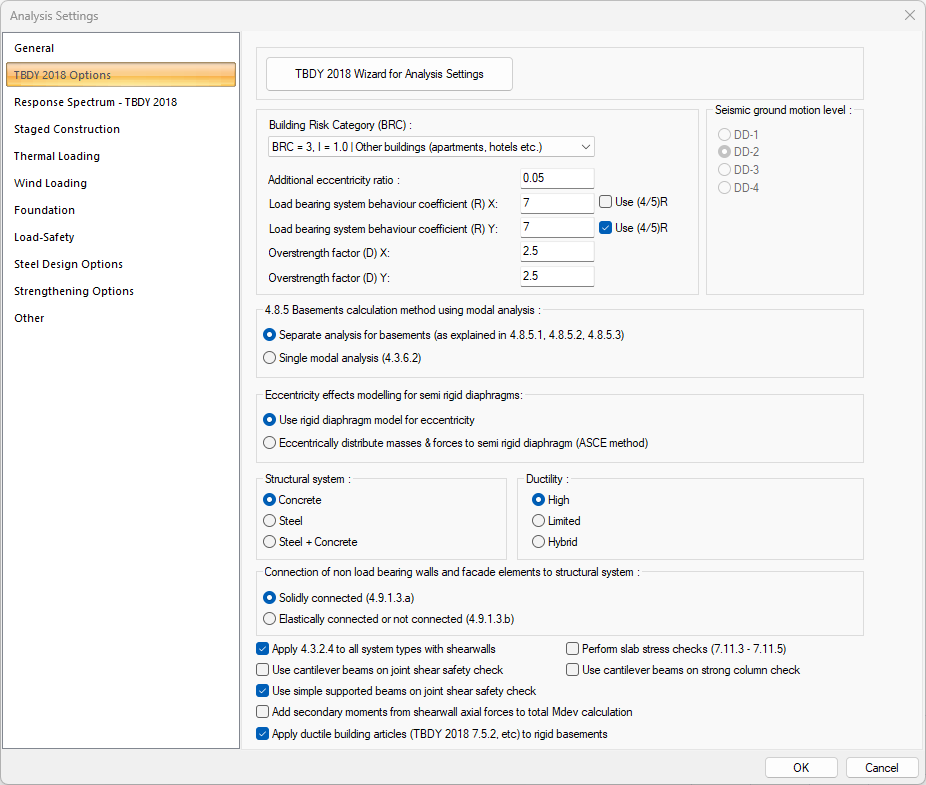
NOTE: In cases where the "Apply (4/5)R" option must be selected in accordance with TBDY 4.3.2.4, the spectrum curve must be redefined by repeating the steps described above, this time using the modified Ra coefficient calculated with (4/5)R.
In the spectrum curve where the R, D, and I coefficients are applied, the R value must be replaced with (4/5)R.
-
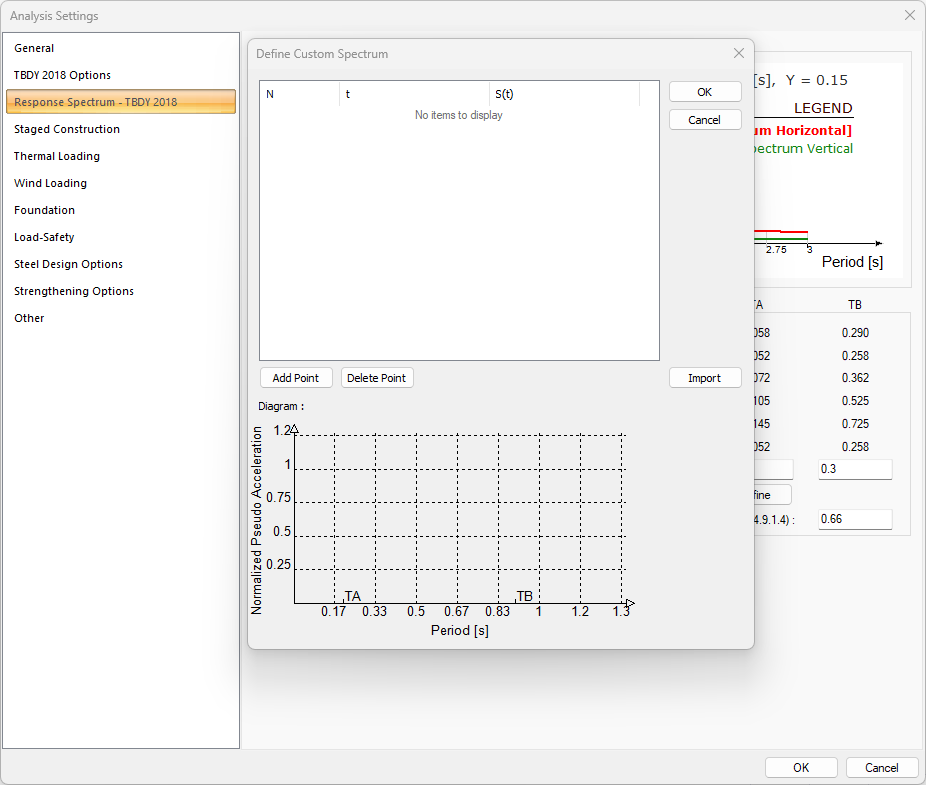
After dismissing the warning, use the Import option in the window that appears. Import the previously created
.txtfile containing the spectrum data. -
Once the above steps have been completed, the resulting curve should appear as shown in the figure below. There should not be a plateau region in the graph. If a plateau is present, it indicates that the elastic design spectrum has not been reduced by the Ra coefficient. In such a case, please return to the beginning of the page and ensure that the procedures summarized in the first three steps have been followed accurately and completely.
-
In the TBDY 2018 Design Spectra tab, it is necessary to enter the correct value of the lambda (λ) coefficient located under the ZF site class. The program uses the λ coefficient in the calculation of relative displacement. Since the user interface currently allows input of only a single value, it is recommended to enter the most unfavorable λ value to be used for both the X and Y directions.
-
If different Structural Systems are selected for the X and Y seismic directions, the R and D coefficients will differ accordingly. As a result, the SaR(T) design spectrum may need to be defined separately for each direction.
-
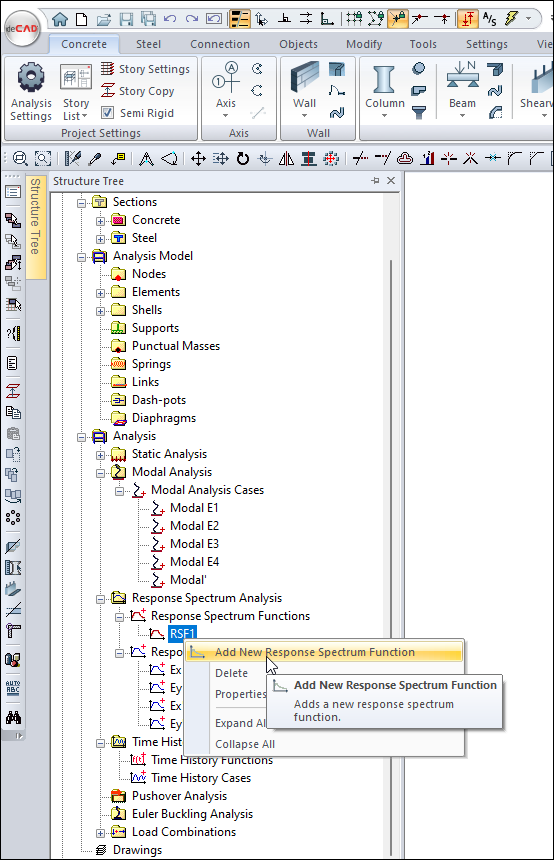
From the Structure Tree, navigate to Analysis → Design Spectrum Analysis → Design Spectrum, then right-click to open the context menu and select Add New Design Spectrum Function.
-
The Design Spectrum Function window will open. Apply the same procedures described above to define the SaR(T) spectrum for the corresponding seismic direction. It is recommended to assign a distinct and descriptive name to the function for clarity. In this example, the function name is set as "SaRX" to indicate that it is defined for the X-direction seismic loading.
-
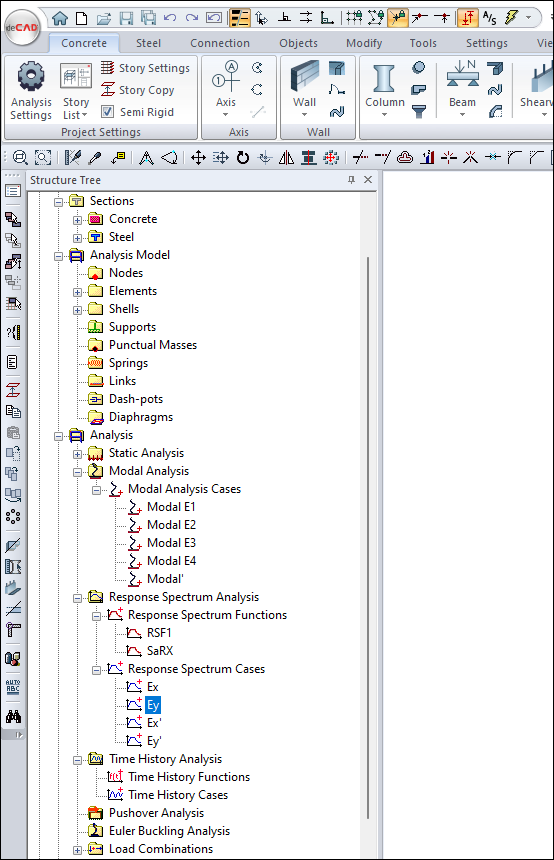
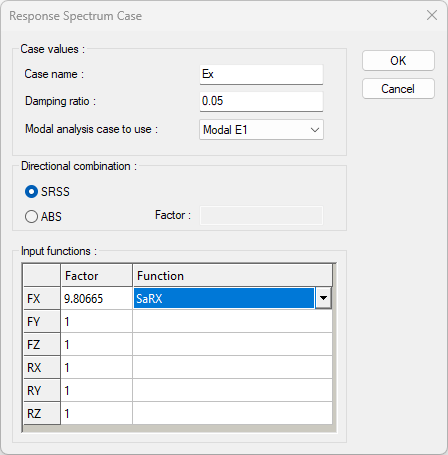
In the structure tree, double-click the relevant earthquake case Ex or Ey in the Analysis → Response Spectrum Analysis → Response Spectrum Cases section. The Design Spectrum Case window will open.
-
From the Design Spectrum Assignment window, select the spectrum function you have defined for the corresponding seismic direction. In this example, since an SaR(T) spectrum has been defined for the X-direction, select the "SaRX" function under the FX field.
-
Similar operations can be performed for the Y earthquake direction and two different S aR (T) spectrum functions can be defined for two different earthquake loadings.