
Symbols
SDS = Short period design spectral acceleration coefficient [dimensionless]
SD1 = Design spectral acceleration coefficient for 1.0 second period [dimensionless]
SS = Short period map spectral acceleration coefficient [dimensionless]
S1 = Map spectral acceleration coefficient for 1.0 second period [ dimensionless]
T = Natural vibration period [s]
TA = Horizontal elastic design acceleration spectrum corner period [s]
TB = Horizontal elastic design acceleration spectrum corner period [s]
TL = Transition period to the constant displacement region in the horizontal elastic design spectrum [s]
Sae(T) = Horizontal elastic design spectral acceleration [g]
SaR(T) = Reduced horizontal elastic design spectral acceleration [g]
R = Structural system response coefficient
Ra(T) = Earthquake load reduction coefficient
D = Strength coefficient
I = Building importance factor
-
The excel file containing the following calculations can be accessed.
Reduced Design Spectrum of the Building
-
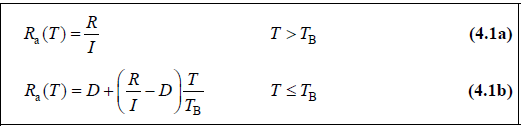
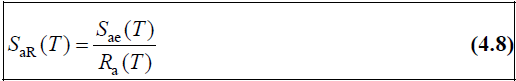
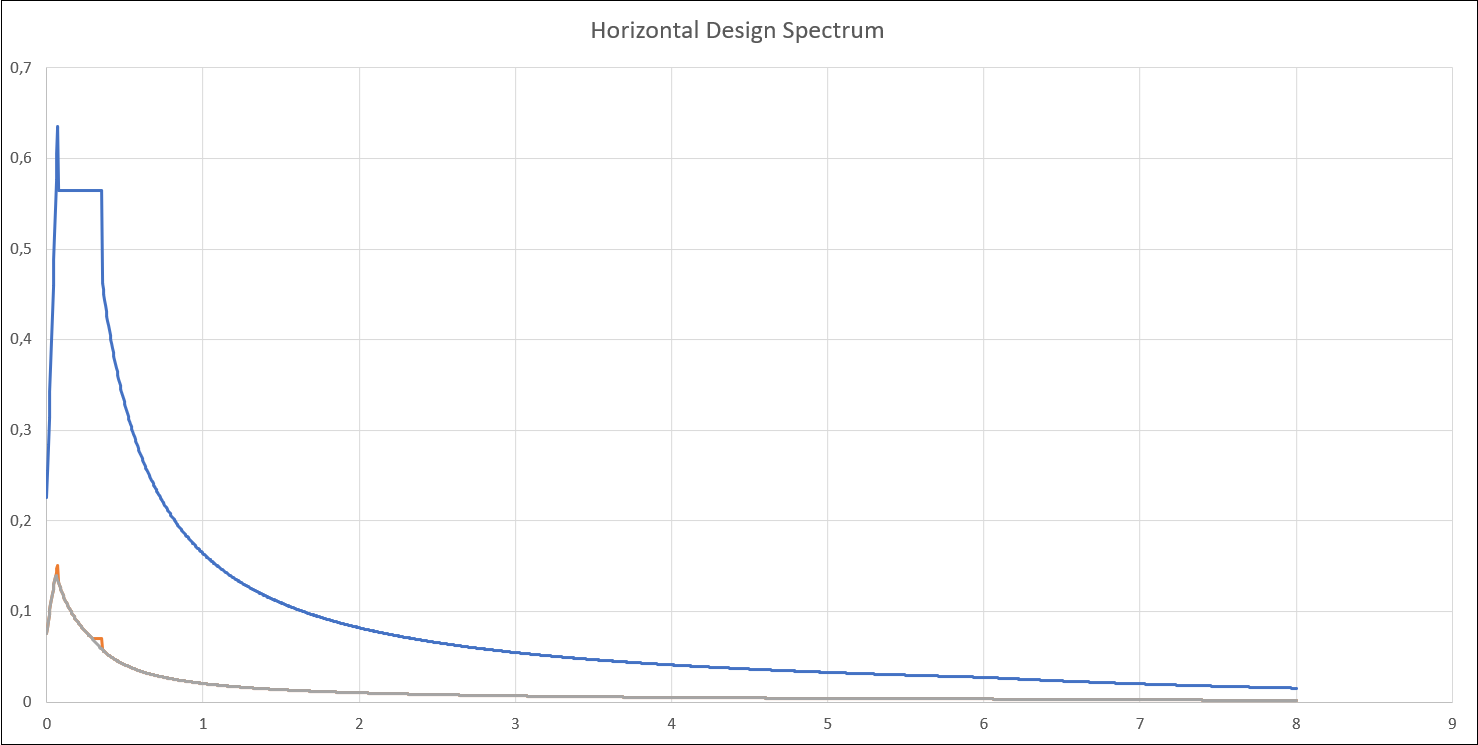
In TBDY 2018 4.2.1.2, the horizontal elastic design spectrum is reduced by earthquake load reduction coefficient Ra(T).
-
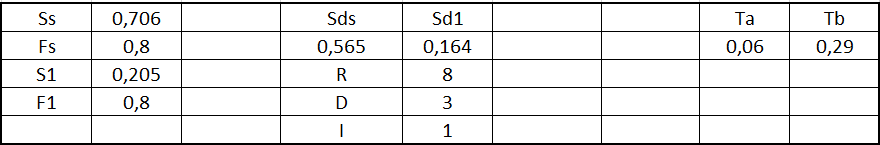
By using Building Importance Factor I=1 for the upper part of the building and R=4.8, D=2.5 in the X and Y directions, a reduced horizontal elastic design spectrum in both directions is obtained for DD-2.
-
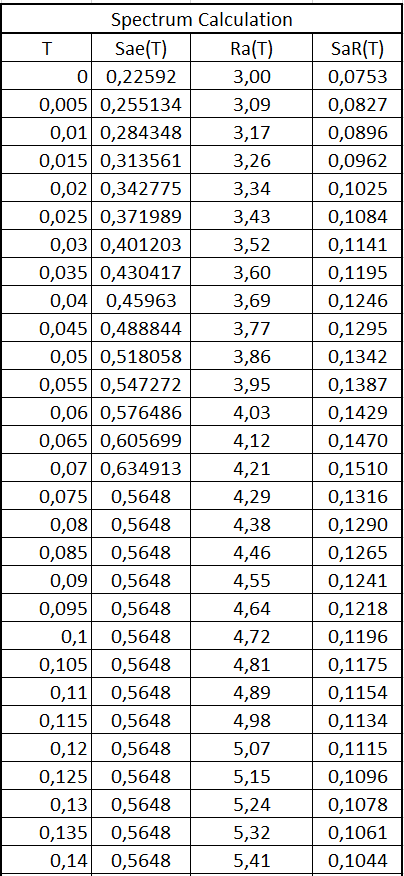
The following images show the calculation of Ra(T) and the reduced design spectrum with excel. The equations given above are used in this calculation.
-
The interval for T is taken as 0.005 s for precision calculation. Therefore, the entire spectrum cannot be shown in the image above. It is given below graphically.
-
To get the reduced design acceleration spectrum that the program calculates for the upper part, simply type ‘exportspectrum' in the lower toolbar command line and press enter. It saves the file as 'exp_spec.txt’ in the Computer: C: Program Files :ideCAD v10 folder. From folder, you can take the txt file and compare the spectrum calculated by the program with the manual calculation in excel.
-
In the graph above, it is seen that the manually calculated reduced spectrum and the reduced spectrum calculated by ideCAD overlap and the calculation is correct.