Symbols
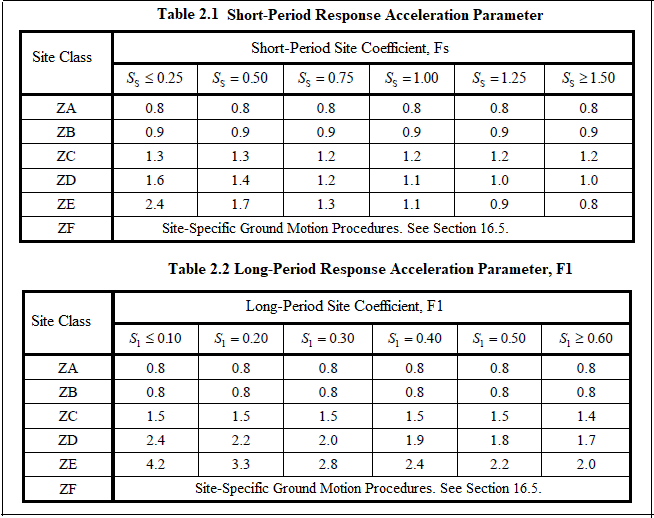
FS = short-period site coefficient
F1 = long-period site coefficient (at 1.0-s period)
SDS = Short-period design spectral acceleration coefficient [dimensionless]
SD1 = Design spectral acceleration coefficient for a period of 1.0 second [dimensionless]
SS = mapped spectral response acceleration parameter at short periods
S1 = mapped spectral response acceleration parameter at a period of 1 s
T = the fundamental period of the structure, s
TA = Horizontal elastic design acceleration spectrum characteristic period
TB = Horizontal elastic design acceleration spectrum characteristic period
TL = long-period transition period
Sae(T) = Horizontal elastic design spectral response acceleration [g]
-
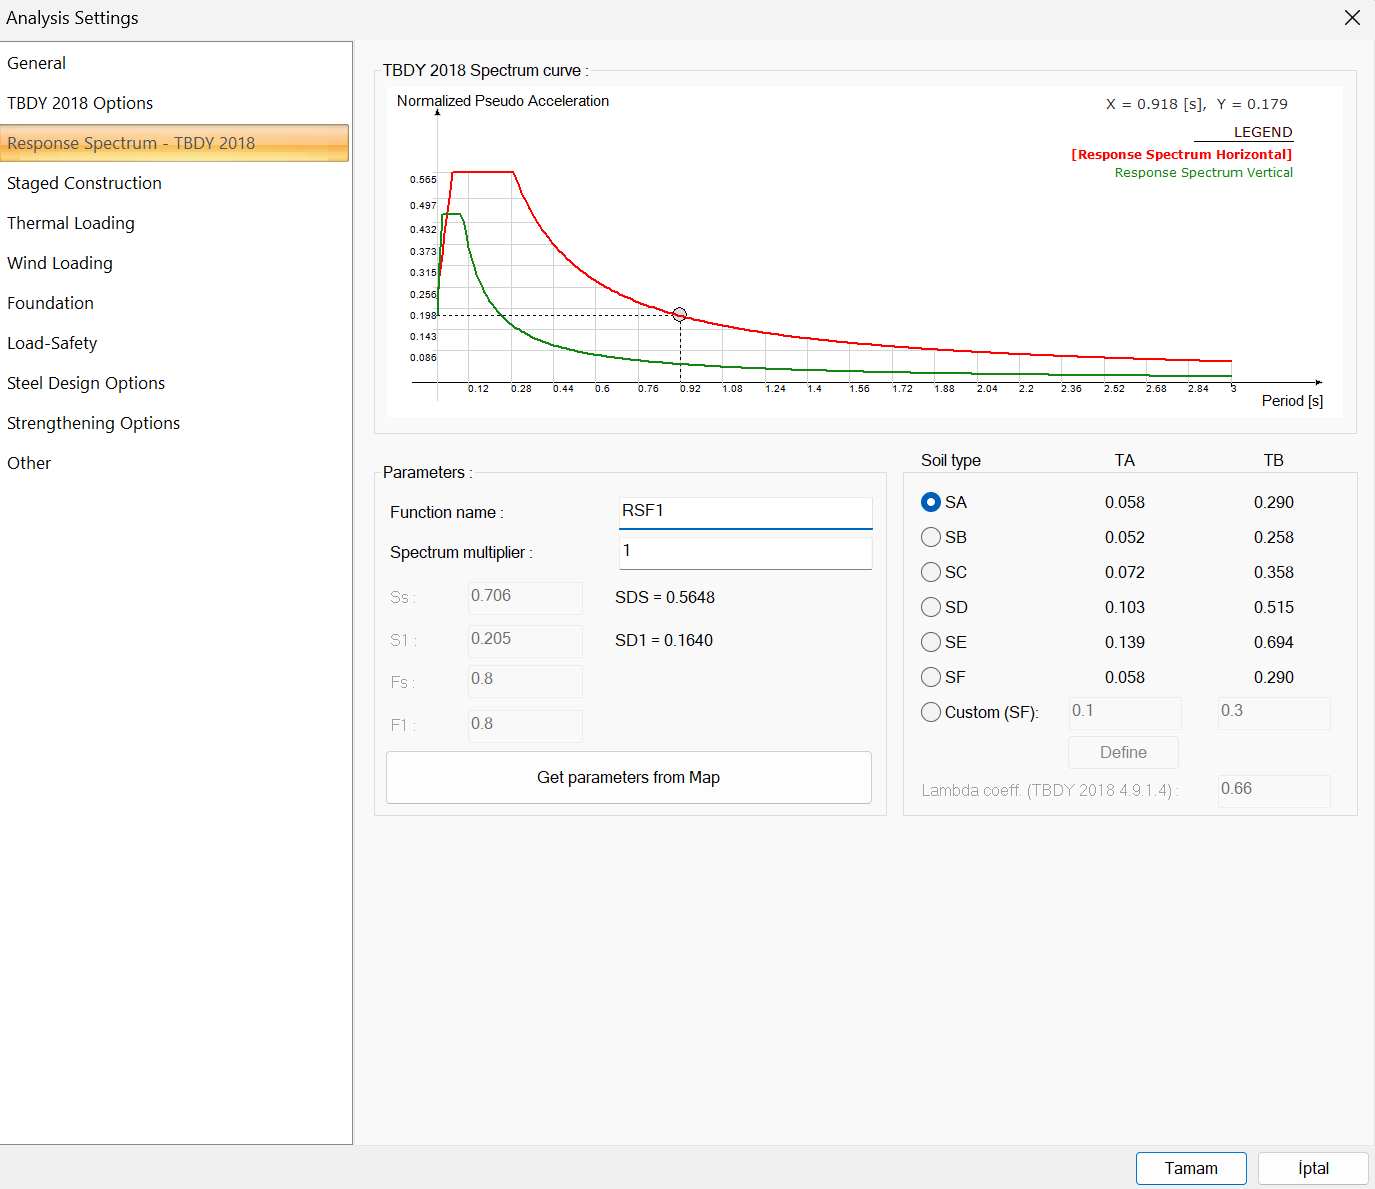
The map spectral acceleration coefficients Ss and S1 values of the coordinates, specified at Building Geometry and Location, were obtained from the AFAD earthquake map data using the Analysis Wizard online option.
-
According to the ZA local soil class specified in the geotechnical report, local soil effect coefficients are obtained from TBDY 2018 Table 2.1, and ideCAD Structural automatically calculates the design spectral acceleration coefficients.
|
Ss |
0.706 |
|
S1 |
0.205 |
|
Fs |
0.8 |
|
F1 |
0.8 |
|
SDS |
|
|
SD1 |
|
|
TA |
|
|
TB |
|
'%3e%3cg transform='translate(167%2c0)'%3e%3cg transform='translate(-13%2c0)'%3e%3cg transform='translate(0%2c-50)'%3e%3cuse xlink:href='%23MJMATHI-53' x='0' y='0'%3e%3c/use%3e%3cg transform='translate(613%2c-155)'%3e%3cuse transform='scale(0.707)' xlink:href='%23MJMATHI-44' x='0' y='0'%3e%3c/use%3e%3cuse transform='scale(0.707)' xlink:href='%23MJMATHI-53' x='828' y='0'%3e%3c/use%3e%3c/g%3e%3cuse xlink:href='%23MJMAIN-3D' x='2033' y='0'%3e%3c/use%3e%3cg transform='translate(3089%2c0)'%3e%3cuse xlink:href='%23MJMATHI-53' x='0' y='0'%3e%3c/use%3e%3cuse transform='scale(0.707)' xlink:href='%23MJMATHI-53' x='867' y='-219'%3e%3c/use%3e%3c/g%3e%3cg transform='translate(4259%2c0)'%3e%3cuse xlink:href='%23MJMATHI-46' x='0' y='0'%3e%3c/use%3e%3cuse transform='scale(0.707)' xlink:href='%23MJMATHI-53' x='910' y='-219'%3e%3c/use%3e%3c/g%3e%3cuse xlink:href='%23MJMAIN-3D' x='5737' y='0'%3e%3c/use%3e%3cg transform='translate(6793%2c0)'%3e%3cuse xlink:href='%23MJMAIN-30'%3e%3c/use%3e%3cuse xlink:href='%23MJMAIN-2E' x='500' y='0'%3e%3c/use%3e%3cuse xlink:href='%23MJMAIN-37' x='779' y='0'%3e%3c/use%3e%3cuse xlink:href='%23MJMAIN-30' x='1279' y='0'%3e%3c/use%3e%3cuse xlink:href='%23MJMAIN-36' x='1780' y='0'%3e%3c/use%3e%3c/g%3e%3cuse xlink:href='%23MJMAIN-D7' x='9296' y='0'%3e%3c/use%3e%3cg transform='translate(10297%2c0)'%3e%3cuse xlink:href='%23MJMAIN-30'%3e%3c/use%3e%3cuse xlink:href='%23MJMAIN-2E' x='500' y='0'%3e%3c/use%3e%3cuse xlink:href='%23MJMAIN-38' x='779' y='0'%3e%3c/use%3e%3c/g%3e%3cuse xlink:href='%23MJMAIN-3D' x='11854' y='0'%3e%3c/use%3e%3cg transform='translate(12910%2c0)'%3e%3cuse xlink:href='%23MJMAIN-30'%3e%3c/use%3e%3cuse xlink:href='%23MJMAIN-2E' x='500' y='0'%3e%3c/use%3e%3cuse xlink:href='%23MJMAIN-35' x='779' y='0'%3e%3c/use%3e%3cuse xlink:href='%23MJMAIN-36' x='1279' y='0'%3e%3c/use%3e%3cuse xlink:href='%23MJMAIN-35' x='1780' y='0'%3e%3c/use%3e%3c/g%3e%3c/g%3e%3c/g%3e%3c/g%3e%3c/g%3e%3c/svg%3e)
'%3e%3cg transform='translate(167%2c0)'%3e%3cg transform='translate(-13%2c0)'%3e%3cg transform='translate(0%2c-50)'%3e%3cuse xlink:href='%23MJMATHI-53' x='0' y='0'%3e%3c/use%3e%3cg transform='translate(613%2c-150)'%3e%3cuse transform='scale(0.707)' xlink:href='%23MJMATHI-44' x='0' y='0'%3e%3c/use%3e%3cuse transform='scale(0.707)' xlink:href='%23MJMAIN-31' x='828' y='0'%3e%3c/use%3e%3c/g%3e%3cuse xlink:href='%23MJMAIN-3D' x='1931' y='0'%3e%3c/use%3e%3cg transform='translate(2987%2c0)'%3e%3cuse xlink:href='%23MJMATHI-53' x='0' y='0'%3e%3c/use%3e%3cuse transform='scale(0.707)' xlink:href='%23MJMAIN-31' x='867' y='-213'%3e%3c/use%3e%3c/g%3e%3cg transform='translate(4054%2c0)'%3e%3cuse xlink:href='%23MJMATHI-46' x='0' y='0'%3e%3c/use%3e%3cuse transform='scale(0.707)' xlink:href='%23MJMAIN-31' x='910' y='-213'%3e%3c/use%3e%3c/g%3e%3cuse xlink:href='%23MJMAIN-3D' x='5429' y='0'%3e%3c/use%3e%3cg transform='translate(6486%2c0)'%3e%3cuse xlink:href='%23MJMAIN-30'%3e%3c/use%3e%3cuse xlink:href='%23MJMAIN-2E' x='500' y='0'%3e%3c/use%3e%3cuse xlink:href='%23MJMAIN-32' x='779' y='0'%3e%3c/use%3e%3cuse xlink:href='%23MJMAIN-30' x='1279' y='0'%3e%3c/use%3e%3cuse xlink:href='%23MJMAIN-35' x='1780' y='0'%3e%3c/use%3e%3c/g%3e%3cuse xlink:href='%23MJMAIN-D7' x='8988' y='0'%3e%3c/use%3e%3cg transform='translate(9989%2c0)'%3e%3cuse xlink:href='%23MJMAIN-30'%3e%3c/use%3e%3cuse xlink:href='%23MJMAIN-2E' x='500' y='0'%3e%3c/use%3e%3cuse xlink:href='%23MJMAIN-38' x='779' y='0'%3e%3c/use%3e%3c/g%3e%3cuse xlink:href='%23MJMAIN-3D' x='11546' y='0'%3e%3c/use%3e%3cg transform='translate(12603%2c0)'%3e%3cuse xlink:href='%23MJMAIN-30'%3e%3c/use%3e%3cuse xlink:href='%23MJMAIN-2E' x='500' y='0'%3e%3c/use%3e%3cuse xlink:href='%23MJMAIN-31' x='779' y='0'%3e%3c/use%3e%3cuse xlink:href='%23MJMAIN-36' x='1279' y='0'%3e%3c/use%3e%3cuse xlink:href='%23MJMAIN-34' x='1780' y='0'%3e%3c/use%3e%3c/g%3e%3c/g%3e%3c/g%3e%3c/g%3e%3c/g%3e%3c/svg%3e)
'%3e%3cg transform='translate(167%2c0)'%3e%3cg transform='translate(-13%2c0)'%3e%3cg transform='translate(0%2c-6)'%3e%3cuse xlink:href='%23MJMATHI-54' x='0' y='0'%3e%3c/use%3e%3cuse transform='scale(0.707)' xlink:href='%23MJMATHI-41' x='826' y='-230'%3e%3c/use%3e%3cuse xlink:href='%23MJMAIN-3D' x='1492' y='0'%3e%3c/use%3e%3cg transform='translate(2549%2c0)'%3e%3cuse xlink:href='%23MJMAIN-30'%3e%3c/use%3e%3cuse xlink:href='%23MJMAIN-2E' x='500' y='0'%3e%3c/use%3e%3cuse xlink:href='%23MJMAIN-32' x='779' y='0'%3e%3c/use%3e%3c/g%3e%3cg transform='translate(3828%2c0)'%3e%3cg transform='translate(120%2c0)'%3e%3crect stroke='none' width='1875' height='60' x='0' y='220'%3e%3c/rect%3e%3cg transform='translate(111%2c676)'%3e%3cuse xlink:href='%23MJMATHI-53' x='0' y='0'%3e%3c/use%3e%3cg transform='translate(613%2c-150)'%3e%3cuse transform='scale(0.707)' xlink:href='%23MJMATHI-44' x='0' y='0'%3e%3c/use%3e%3cuse transform='scale(0.707)' xlink:href='%23MJMAIN-31' x='828' y='0'%3e%3c/use%3e%3c/g%3e%3c/g%3e%3cg transform='translate(60%2c-700)'%3e%3cuse xlink:href='%23MJMATHI-53' x='0' y='0'%3e%3c/use%3e%3cg transform='translate(613%2c-155)'%3e%3cuse transform='scale(0.707)' xlink:href='%23MJMATHI-44' x='0' y='0'%3e%3c/use%3e%3cuse transform='scale(0.707)' xlink:href='%23MJMATHI-53' x='828' y='0'%3e%3c/use%3e%3c/g%3e%3c/g%3e%3c/g%3e%3c/g%3e%3cuse xlink:href='%23MJMAIN-3D' x='6222' y='0'%3e%3c/use%3e%3cg transform='translate(7278%2c0)'%3e%3cuse xlink:href='%23MJMAIN-30'%3e%3c/use%3e%3cuse xlink:href='%23MJMAIN-2E' x='500' y='0'%3e%3c/use%3e%3cuse xlink:href='%23MJMAIN-32' x='779' y='0'%3e%3c/use%3e%3c/g%3e%3cuse xlink:href='%23MJMAIN-D7' x='8780' y='0'%3e%3c/use%3e%3cg transform='translate(9781%2c0)'%3e%3cg transform='translate(120%2c0)'%3e%3crect stroke='none' width='2400' height='60' x='0' y='220'%3e%3c/rect%3e%3cg transform='translate(60%2c676)'%3e%3cuse xlink:href='%23MJMAIN-30'%3e%3c/use%3e%3cuse xlink:href='%23MJMAIN-2E' x='500' y='0'%3e%3c/use%3e%3cuse xlink:href='%23MJMAIN-31' x='779' y='0'%3e%3c/use%3e%3cuse xlink:href='%23MJMAIN-36' x='1279' y='0'%3e%3c/use%3e%3cuse xlink:href='%23MJMAIN-34' x='1780' y='0'%3e%3c/use%3e%3c/g%3e%3cg transform='translate(60%2c-686)'%3e%3cuse xlink:href='%23MJMAIN-30'%3e%3c/use%3e%3cuse xlink:href='%23MJMAIN-2E' x='500' y='0'%3e%3c/use%3e%3cuse xlink:href='%23MJMAIN-35' x='779' y='0'%3e%3c/use%3e%3cuse xlink:href='%23MJMAIN-36' x='1279' y='0'%3e%3c/use%3e%3cuse xlink:href='%23MJMAIN-35' x='1780' y='0'%3e%3c/use%3e%3c/g%3e%3c/g%3e%3c/g%3e%3cuse xlink:href='%23MJMAIN-3D' x='12699' y='0'%3e%3c/use%3e%3cg transform='translate(13755%2c0)'%3e%3cuse xlink:href='%23MJMAIN-30'%3e%3c/use%3e%3cuse xlink:href='%23MJMAIN-2E' x='500' y='0'%3e%3c/use%3e%3cuse xlink:href='%23MJMAIN-30' x='779' y='0'%3e%3c/use%3e%3cuse xlink:href='%23MJMAIN-35' x='1279' y='0'%3e%3c/use%3e%3cuse xlink:href='%23MJMAIN-38' x='1780' y='0'%3e%3c/use%3e%3c/g%3e%3c/g%3e%3c/g%3e%3c/g%3e%3c/g%3e%3c/svg%3e)
'%3e%3cg transform='translate(167%2c0)'%3e%3cg transform='translate(-13%2c0)'%3e%3cg transform='translate(0%2c-6)'%3e%3cuse xlink:href='%23MJMATHI-54' x='0' y='0'%3e%3c/use%3e%3cuse transform='scale(0.707)' xlink:href='%23MJMATHI-42' x='826' y='-213'%3e%3c/use%3e%3cuse xlink:href='%23MJMAIN-3D' x='1499' y='0'%3e%3c/use%3e%3cg transform='translate(2555%2c0)'%3e%3cg transform='translate(120%2c0)'%3e%3crect stroke='none' width='1875' height='60' x='0' y='220'%3e%3c/rect%3e%3cg transform='translate(111%2c676)'%3e%3cuse xlink:href='%23MJMATHI-53' x='0' y='0'%3e%3c/use%3e%3cg transform='translate(613%2c-150)'%3e%3cuse transform='scale(0.707)' xlink:href='%23MJMATHI-44' x='0' y='0'%3e%3c/use%3e%3cuse transform='scale(0.707)' xlink:href='%23MJMAIN-31' x='828' y='0'%3e%3c/use%3e%3c/g%3e%3c/g%3e%3cg transform='translate(60%2c-700)'%3e%3cuse xlink:href='%23MJMATHI-53' x='0' y='0'%3e%3c/use%3e%3cg transform='translate(613%2c-155)'%3e%3cuse transform='scale(0.707)' xlink:href='%23MJMATHI-44' x='0' y='0'%3e%3c/use%3e%3cuse transform='scale(0.707)' xlink:href='%23MJMATHI-53' x='828' y='0'%3e%3c/use%3e%3c/g%3e%3c/g%3e%3c/g%3e%3c/g%3e%3cuse xlink:href='%23MJMAIN-3D' x='4949' y='0'%3e%3c/use%3e%3cg transform='translate(6005%2c0)'%3e%3cg transform='translate(120%2c0)'%3e%3crect stroke='none' width='2400' height='60' x='0' y='220'%3e%3c/rect%3e%3cg transform='translate(60%2c676)'%3e%3cuse xlink:href='%23MJMAIN-30'%3e%3c/use%3e%3cuse xlink:href='%23MJMAIN-2E' x='500' y='0'%3e%3c/use%3e%3cuse xlink:href='%23MJMAIN-31' x='779' y='0'%3e%3c/use%3e%3cuse xlink:href='%23MJMAIN-36' x='1279' y='0'%3e%3c/use%3e%3cuse xlink:href='%23MJMAIN-34' x='1780' y='0'%3e%3c/use%3e%3c/g%3e%3cg transform='translate(60%2c-686)'%3e%3cuse xlink:href='%23MJMAIN-30'%3e%3c/use%3e%3cuse xlink:href='%23MJMAIN-2E' x='500' y='0'%3e%3c/use%3e%3cuse xlink:href='%23MJMAIN-35' x='779' y='0'%3e%3c/use%3e%3cuse xlink:href='%23MJMAIN-36' x='1279' y='0'%3e%3c/use%3e%3cuse xlink:href='%23MJMAIN-35' x='1780' y='0'%3e%3c/use%3e%3c/g%3e%3c/g%3e%3c/g%3e%3cuse xlink:href='%23MJMAIN-3D' x='8923' y='0'%3e%3c/use%3e%3cg transform='translate(9979%2c0)'%3e%3cuse xlink:href='%23MJMAIN-30'%3e%3c/use%3e%3cuse xlink:href='%23MJMAIN-2E' x='500' y='0'%3e%3c/use%3e%3cuse xlink:href='%23MJMAIN-32' x='779' y='0'%3e%3c/use%3e%3cuse xlink:href='%23MJMAIN-39' x='1279' y='0'%3e%3c/use%3e%3cuse xlink:href='%23MJMAIN-30' x='1780' y='0'%3e%3c/use%3e%3c/g%3e%3c/g%3e%3c/g%3e%3c/g%3e%3c/g%3e%3c/svg%3e)
-
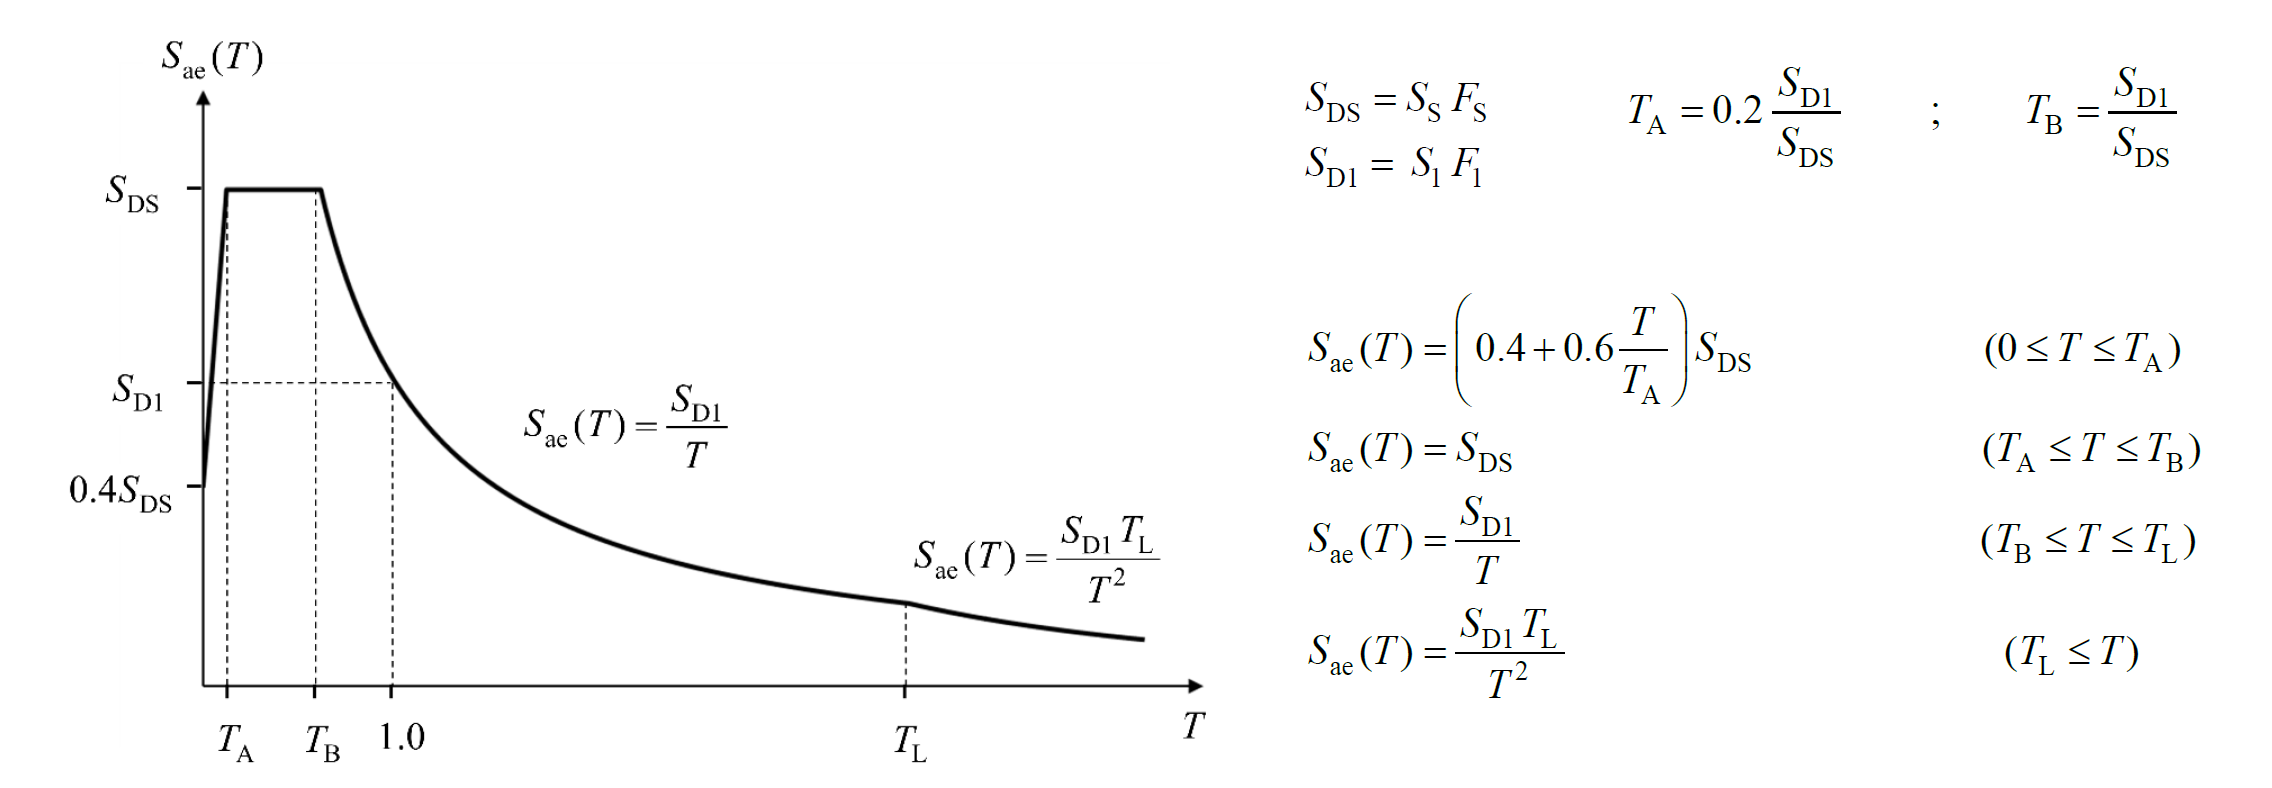
The horizontal elastic design spectral accelerations Sae(T), which are the ordinates of the horizontal elastic design acceleration spectrum for any earthquake ground motion level considered, are defined in terms of gravitational acceleration [g] depending on the natural vibration period.
-
Based on the coordinates, the spectral acceleration coefficients obtained from AFAD and the horizontal elastic design spectrum Sae(T) are determined according to the formula below. For the horizontal elastic design spectrum, it is represented by a total of 4 functions, different in each region, is shown in the graph below.
-
The horizontal elastic design spectrum is created with the “TBDY 2018 Wizard for Analysis Settings” command using spectrum values specified above.
-
The horizontal elastic design spectrum created in the “Analysis Settings” window is shown below.