
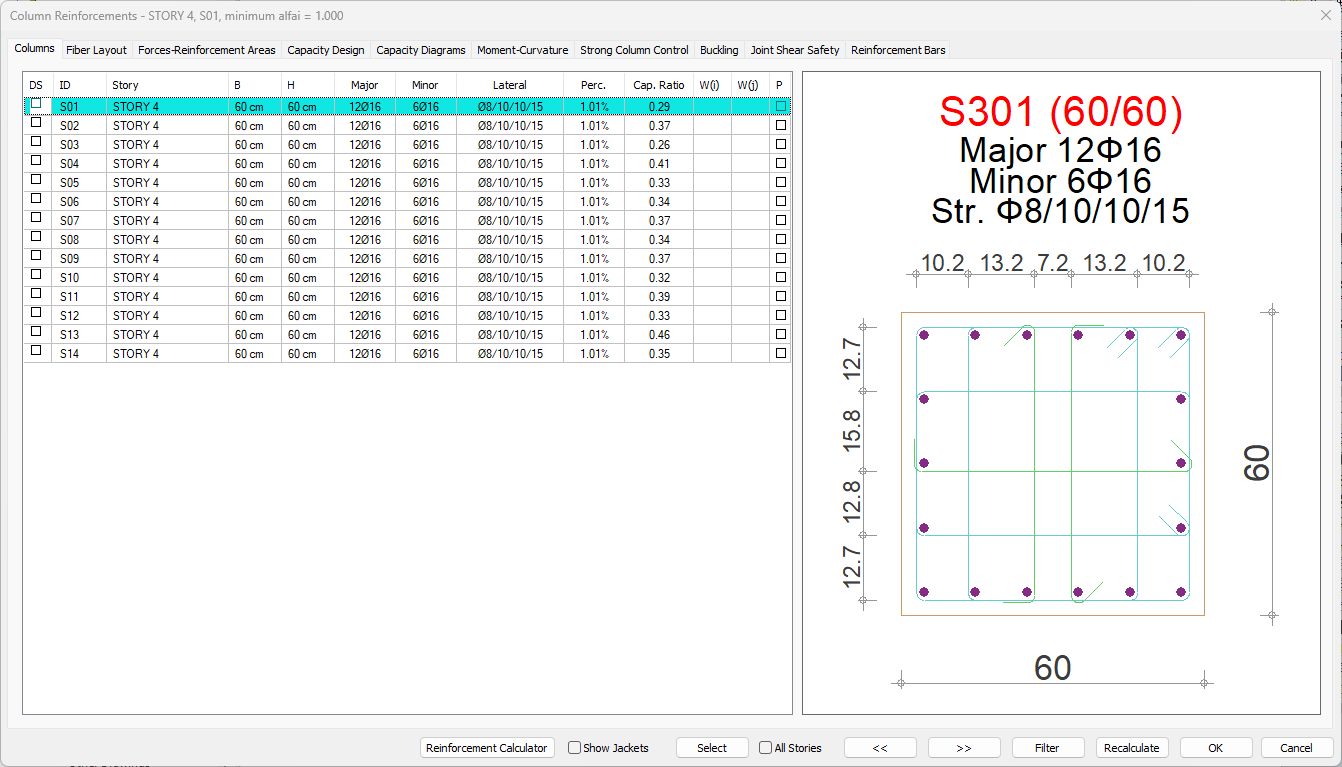
Column reinforcement design results and inadequacy conditions for columns are displayed in the Column Reinforcements dialog. In the column reinforcement dialog, the results of column transverse and longitudinal reinforcements, internal forces calculated as a result of the analysis, increased internal forces related to TBDY, capacity ratios, shear safety of column-beam connection, strong column control are given. Column reinforcements are changed and fixed in the Column Reinforcements dialog.
Location of Column Reinforcements Dialogue
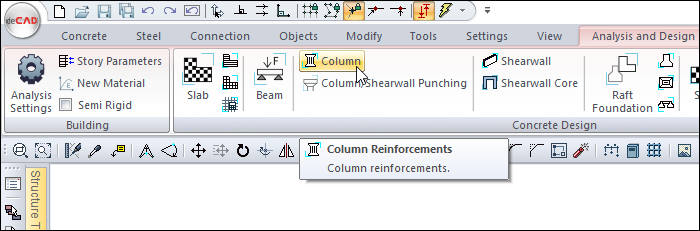
After analysis, you can access it by clicking the Column Reinforcements command under the Concrete Design title of the ribbon menu Analysis and Design tab .
General Specifications of Column Reinforcements Dialogue
|
Summary Information The summary information about the line where the cursor is located is given in the name of the dialog in the form of Layer, Pose. 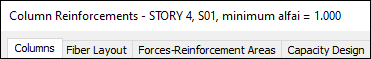
For example, Story 4, S01, minimum alfai=1.000 |
|
Using the Shift key In this tab, you can select more than one row with the Shift key, enter a value by double-clicking any cell whose value is open to change, and make that value apply to all selected rows. |
|
Using the Ctrl key Ctrl key, on the other hand, selects the lines in between one by one. |
|
Reinforcement calculator Calculates the amount of rebar, in area, for the selected diameter and span. |
|
Show jackets It displays the jackets in the column for strengthening projects. |
|
Select Selects the object on the line with the cursor. When the concrete dialog is closed, you can take action for the selected element. |
|
All Stories It lists the slabs on the screen throughout the entire story. |
|
Previous The cursor moves to the previous line. |
|
Next The cursor goes to the next line. |
|
Filter
It is used to define certain conditions and filter only the elements that satisfy that condition. |
|
Recalculate The element rebuilds its concrete. The regulation calculations related to concrete and rebars are also made again. It may be more appropriate to repeat the structure analysis instead of concrete in important changes. |
|
Ok It saves the changes made and closes the dialog. |
|
Cancel Closes the dialog without saving the changes made. |
Insufficiency Code Description and Recommended Solution
|
Insufficiency Code |
Description |
|---|---|
|
B |
Joint shear safety is not satisfied.
|
|
K |
Shear safety is not satisfied.
|
|
F |
Friction-based shear capacity is not satisfied.
|
|
E |
The maximum axial load capacity is exceeded.
|
|
M |
The maximum reinforcement ratio is exceeded.
|
|
ab |
The hook development length is not satisfied as per the Seismic Design Code.
|
|
As(-) |
The provided longitudinal reinforcement is insufficient.
|
|
s |
The transverse reinforcement spacing is not satisfied.
|
|
Z |
Punching shear capacity is not satisfied (typically in slab-column systems).
|
|
R |
The capacity ratio under axial load and biaxial bending exceeds 1.0.
|
Columns Tab
|
Specifications |
|---|
|
DS It is the rebar fixing column. If marked, the rebar is fixed. When the column rebar is changed, DS is automatically marked and when concrete is made, the column rebar remains constant. If DS is not marked, when concrete is made, column rebar is determined again according to rebar selection conditions. |
|
ID 
It is the name of the column in the plan. (S1, S101, S10 etc.) In case of negativity, the term related to negativity is added next to the name. Like S101 (M). |
|
Story 
It is the name of the story where the column is located. |
|
B, H 
They are the dimensions of the column. You can change the dimensions by double clicking in the B and H cells. When the size is changed, column rebar calculation is made for that column according to the changed dimensions. |
|
Major 
It is the value in diameter and number of rebar placed in the major direction of the column (in the y-axis direction). |
|
Minor 
It is the value in diameter and number of rebar placed in the minor direction of the column (in the x-axis direction). |
|
Lateral 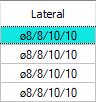
Column stirrup is respectively stirrup diameter, middle, densification and junction area range. |
|
Perc. 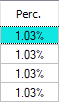
It is the percentage ratio of the total amount of longitudinal rebar to the column area. (Perc. = 100 * TotalAs / ColumnArea) |
|
Cap. Ratio 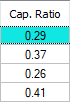
It shows the capacity ratio of concrete columns under the influence of axial force and biaxial bending. |
|
W(i)/W(j) 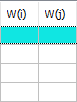
It indicates that the columns' ends i/j do not comply with the condition of being stronger than the beams and are weak columns. |
|
P With this option, you can use the column shear force as the pitch shear force by accepting any column as if it is a shearwall while finding the alpha ratio. You may want to use this option especially for large polygon columns whose arms are like shearwalls. |
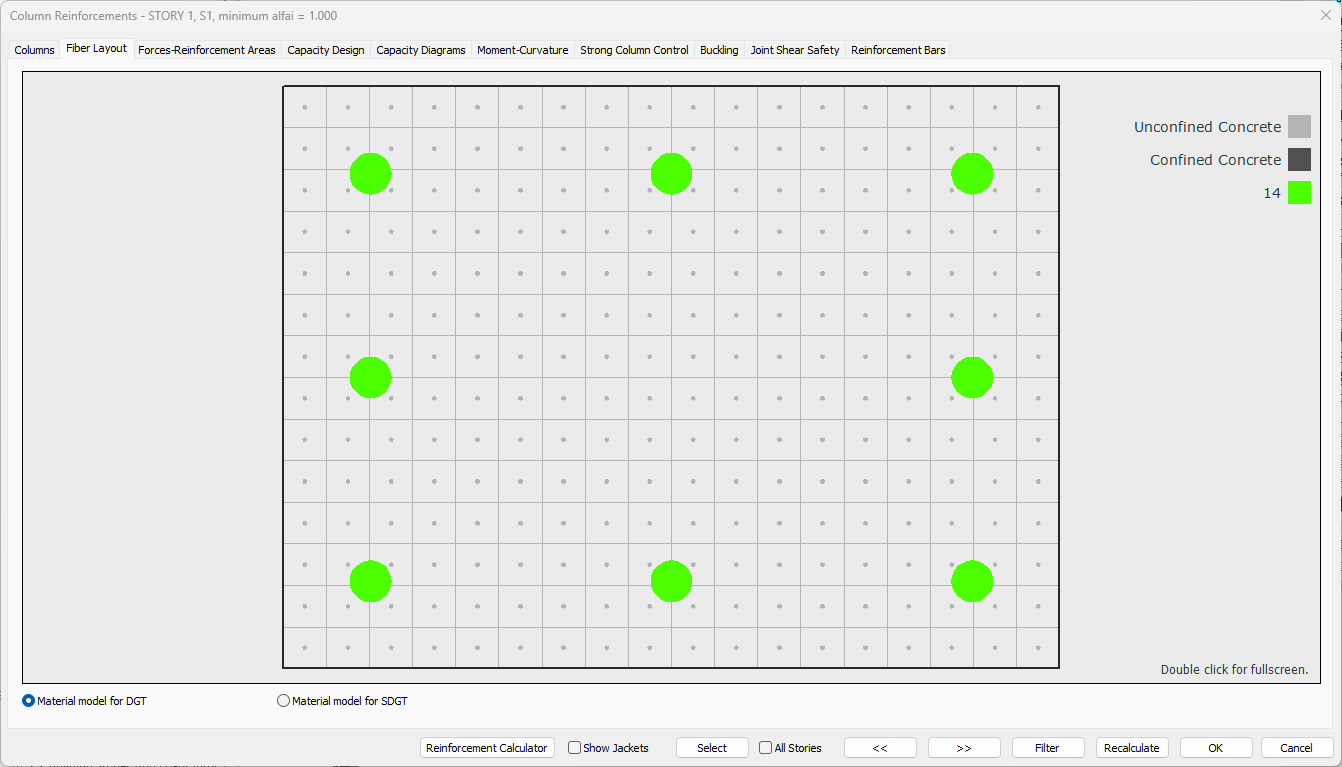
Fiber Layout Tab
|
Specifications |
|---|
|
Preview and legend 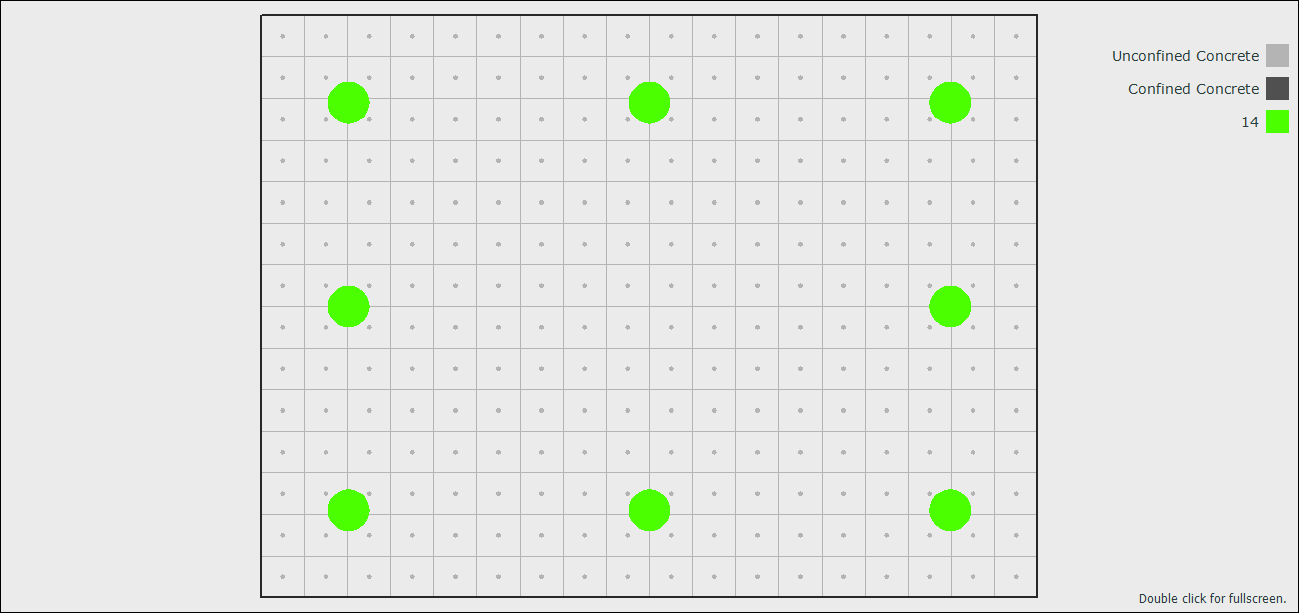
The fiber layout preview and what the colors mean are shown. |
|
Material model for DGT Section cells and rebars are displayed according to the concrete and rebar material model criteria defined in TS500. |
|
Material model for SDGT The section cells and rebars are displayed according to the ŞGDT criteria for the concrete and rebar material model defined in TBDY. |
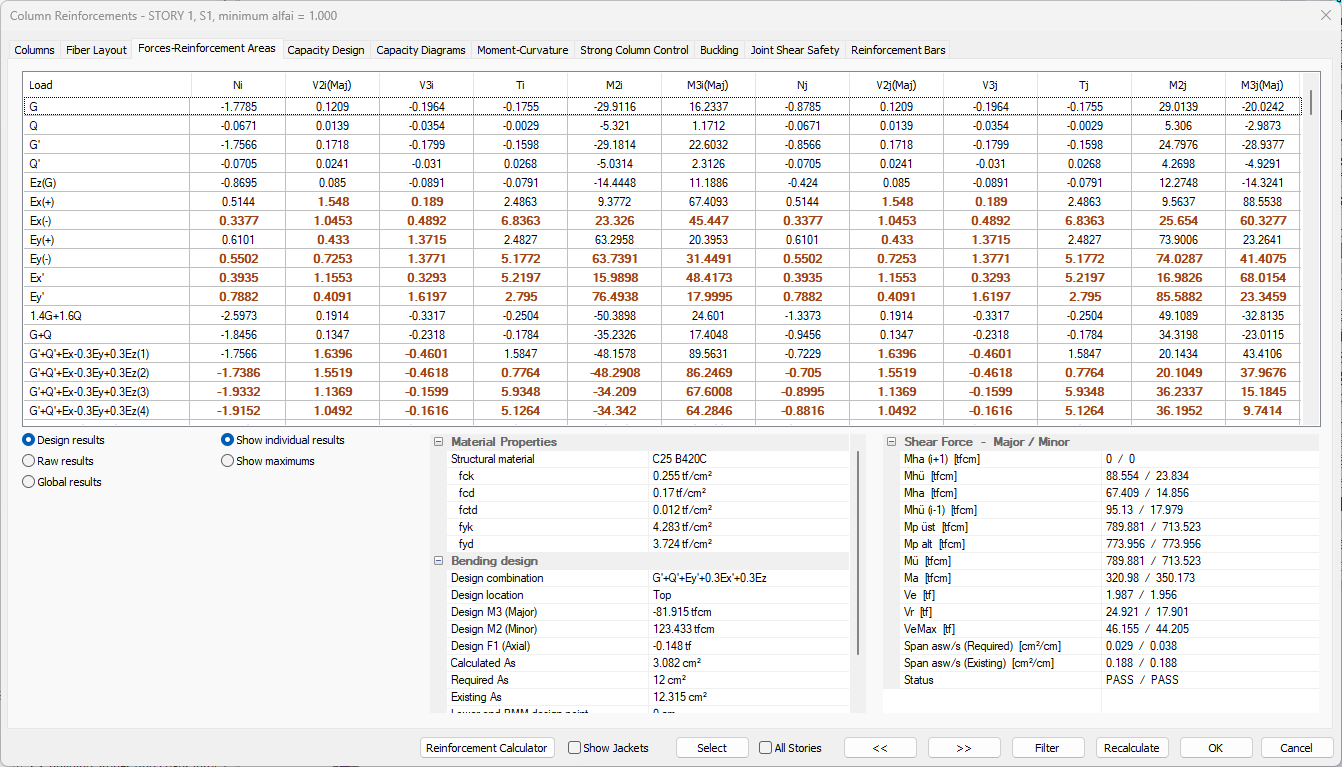
Forces-Reinforcement Area Tab
|
Specifications |
|---|
|
Table of forces 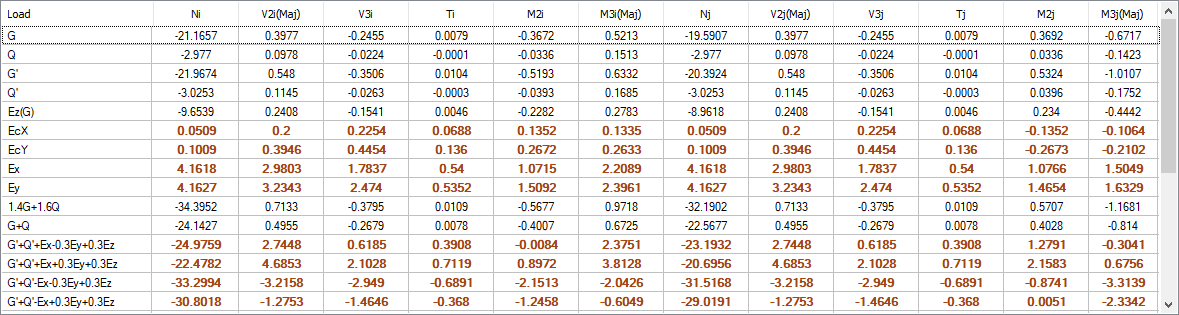
Load: The name of the respective load or load combinations.
|
|
Design results After the analysis, the regulation conditions have been applied, therefore it shows the end forces that have undergone changes and going to the design. In addition, the values used are shown in bold. End forces are values calculated on the element local axes. |
|
Raw results After analysis, it shows the raw end forces that are not applied to the regulation conditions. End forces are effects on the element local axes. |
|
Global results After the analysis, these are the values in global coordinates of the extreme forces that are not applied regulation conditions. |
|
Show individual results For 4 modal analysis cases, 4 different results are obtained from each earthquake loaded combination. If you want the program to display the values obtained for each modal state one by one, you should check this option. |
|
Show maximums The biggest values of 4 different results obtained from each load combination for 4 different modal cases are shown in the table. |
|
Material properties 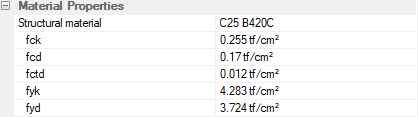
Structural material: The structural material of the column.
|
|
Bending design 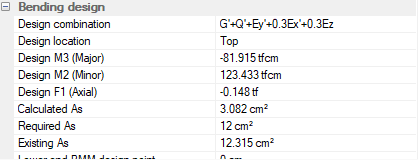
Design combination: Load combination that produces the most unfavorable condition for each applicable factored load combination for column longitudinal reinforcement design.
|
|
Shear force - major/minor 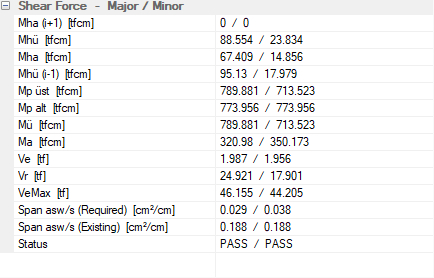
Mha (i + 1): Moment obtained at bottom end of (i+1) ’th story column according to TBDY Sections 3 and 4.
|
Capacity Design Tab

|
Specifications |
|---|
|
Capacity chart 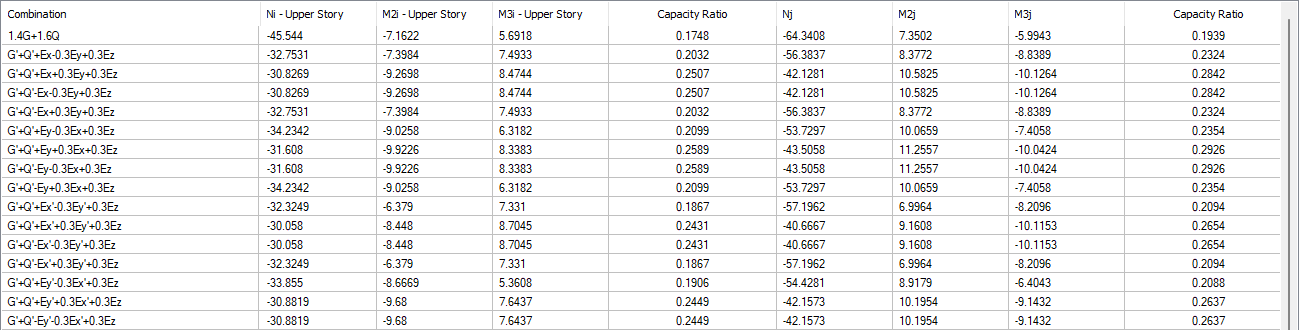
Combination: The corresponding combination is shown.
|
|
Existing area of steel The existing area of steel values for end i, span and j end are shown. |
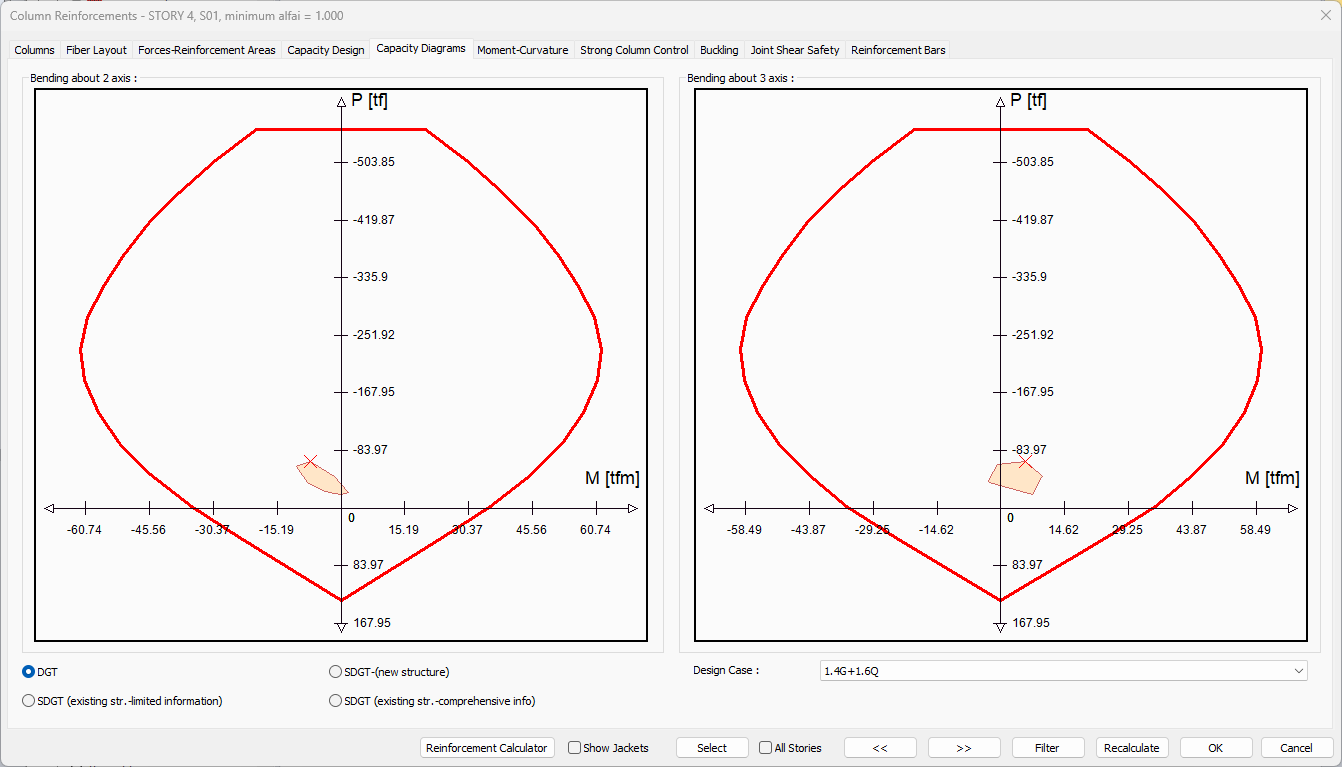
Capacity Diagrams Tab
|
Specifications |
|---|
|
Bending about 2 axis 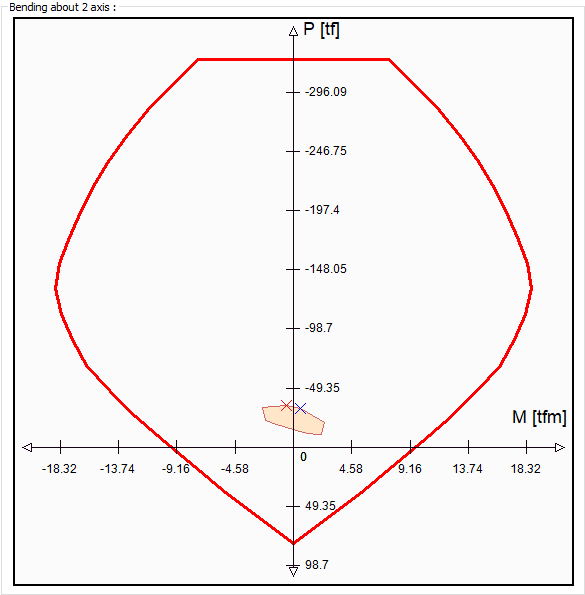
|
|
Bending about 3 axis 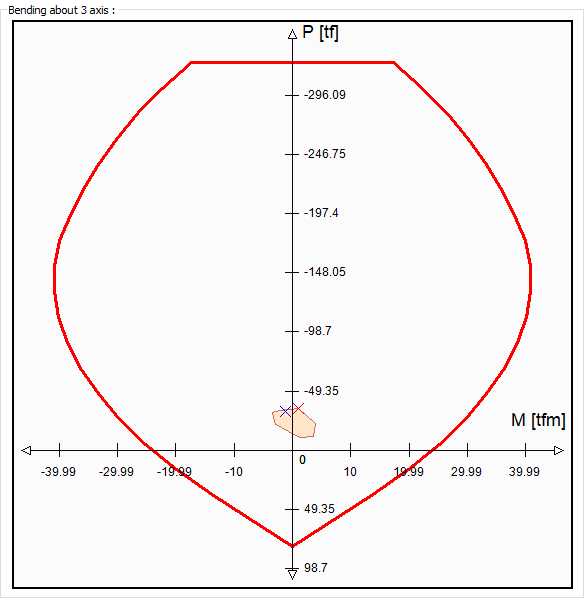
|
|
DGT Section cells and rebars are displayed according to the concrete and rebar material model criteria defined in TS500. |
|
SDGT - (new structure) The section cells and rebars are displayed according to the ŞGDT (new structure) criteria for the concrete and rebar material model defined in TBDY. |
|
SDGT - (existing str. - limited information) The section cells and rebars are displayed according to the ŞGDT (existing structure - limited information) criteria for the concrete and rebar material model defined in TBDY. |
|
SDGT - (existing str. - comprehensive info) The section cells and rebars are displayed according to the ŞGDT (existing structure - comprehensive information) criteria for the concrete and rebar material model defined in TBDY. |
|
Design case The combination for the capacity diagrams to be examined can be selected from the list. |
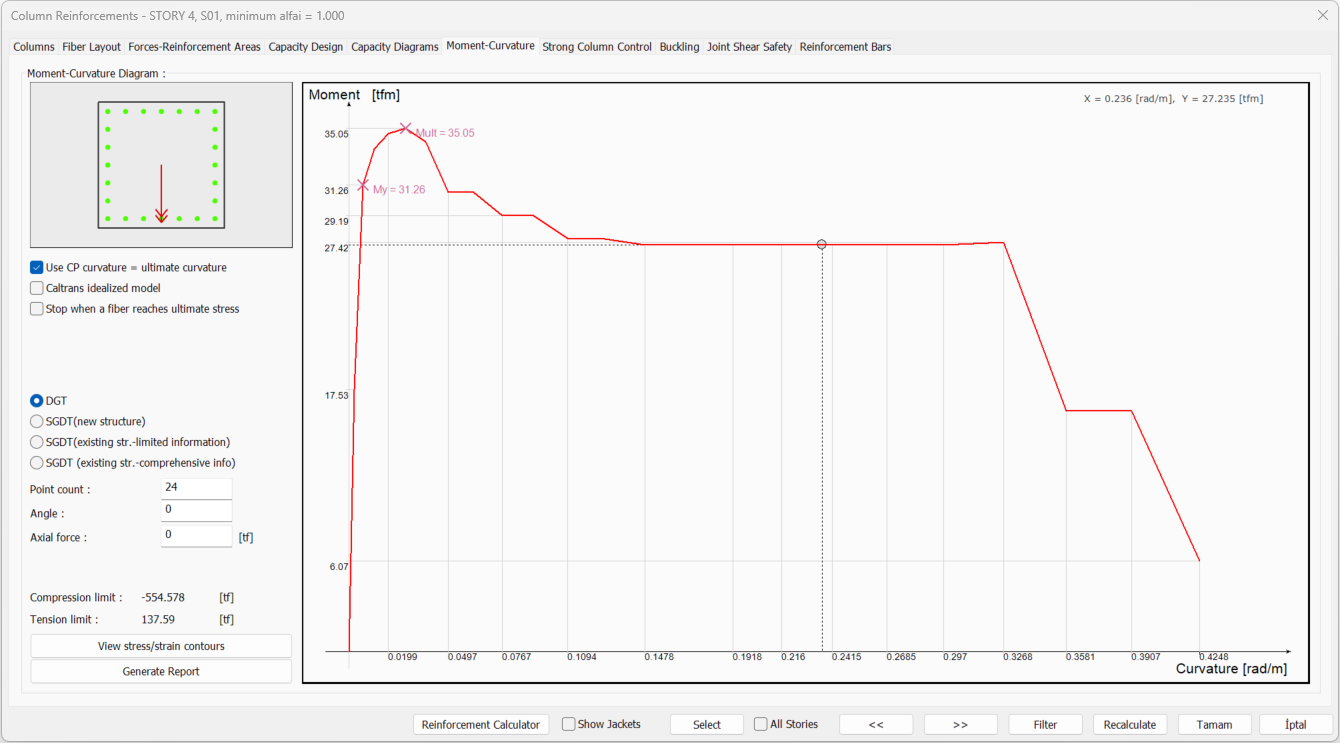
Moment - Curvature Tab
|
Specifications |
|---|
|
Schematic drawing 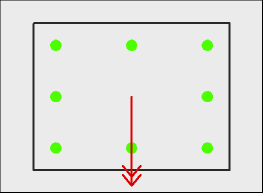
|
|
Moment - curvature diagram 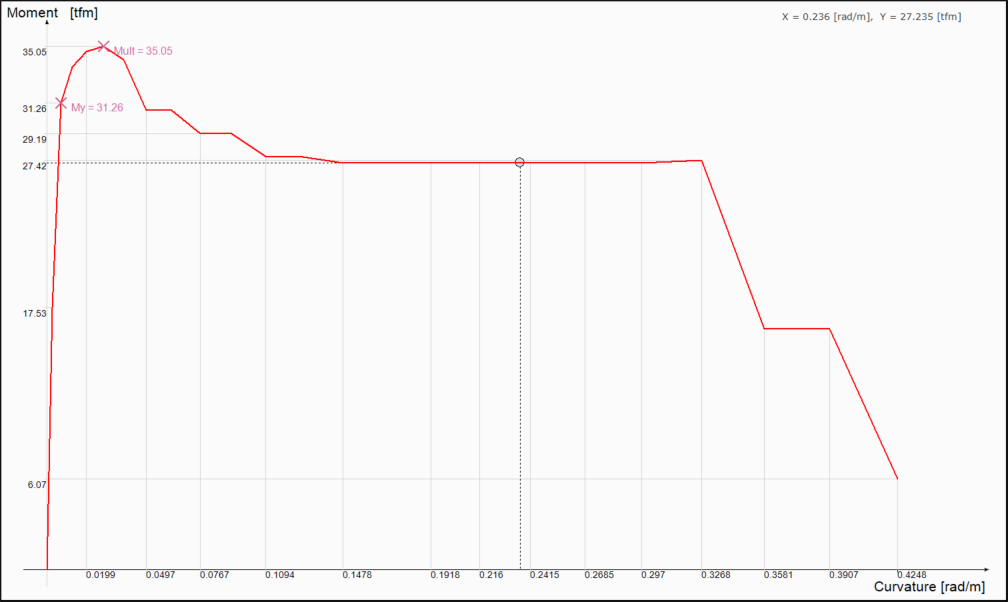
|
|
Use CP curvature = ultimate curvature When this option is selected, the ultimate strain of the concrete and reinforcement material is used to calculate the plastic rotation limit values for performance levels. |
|
Caltrans idealized model If marked, the moment-curvature plot is idealized. It is a moment curvature relationship obtained by drawing a horizontal line that intersects with an inclined line passing over the moment of yield and will equalize the areas between the moment curvature graph. |
|
Stop when a fiber reaches ultimate stress If checked, the graphic ends when the graphic fiber reaches its highest stress. |
|
DGT Section cells and rebars are displayed according to the concrete and rebar material model criteria defined in TS500. |
|
SGDT 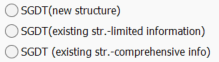
The section cells and rebars are displayed according to the SGDT criteria for the concrete and rebar material model defined in TBDY. |
|
Point count It is used to determine how many points the moment curvature graph consists of. |
|
Angle It shows the neutral axis angle from which the moment curvature relationship is obtained. It is indicated with a red arrow in the image above. |
|
Axial force It shows under which axial force the moment curvature relationship is drawn. |
|
Compression limit The determined material model is the largest axial pressure force that the section can take in the moment-normal force interaction. |
|
Tension limit The determined material model is the largest axial tensile force that the section can take in the moment-normal force interaction. |
|
View stress/strain contours It shows the stress and strain state in section in color format at each step of the moment curvature relationship. |
|
Generate report Creates a detailed report of moment-curvature. |
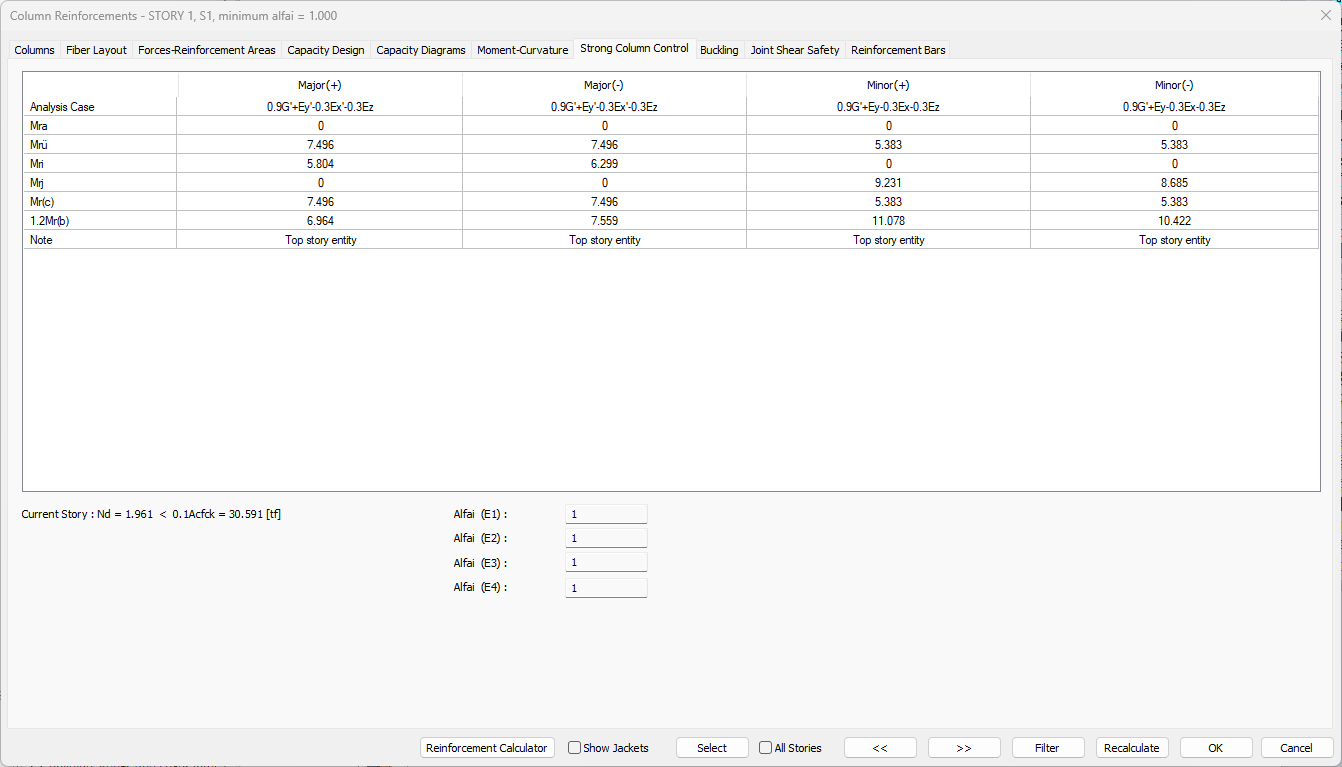
Strong Column Control Tab
|
Specifications |
|---|
|
Control table 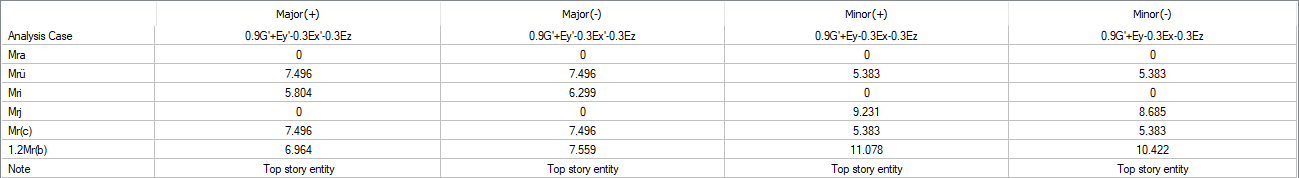
Major (+): Positive major moment direction of column to be taken into account according to the earthquake direction.
|
|
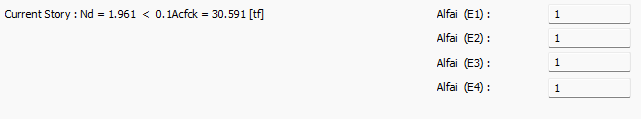
In case of Nd≤ 0.10 Ac fck in both of the columns joining the node point, or at the nodal points of the top floor of single-storey buildings and multi-storey buildings, or if the curtain where the beams are stuck working like a column in a weak direction, the above condition is not compulsory. The bottom line is; Displays whether Nd is greater than 0.1AcFck. |
Nd: It is the axial force value that makes these moments the smallest in accordance with the direction of the earthquake in the calculation of column carrying power moments.
|
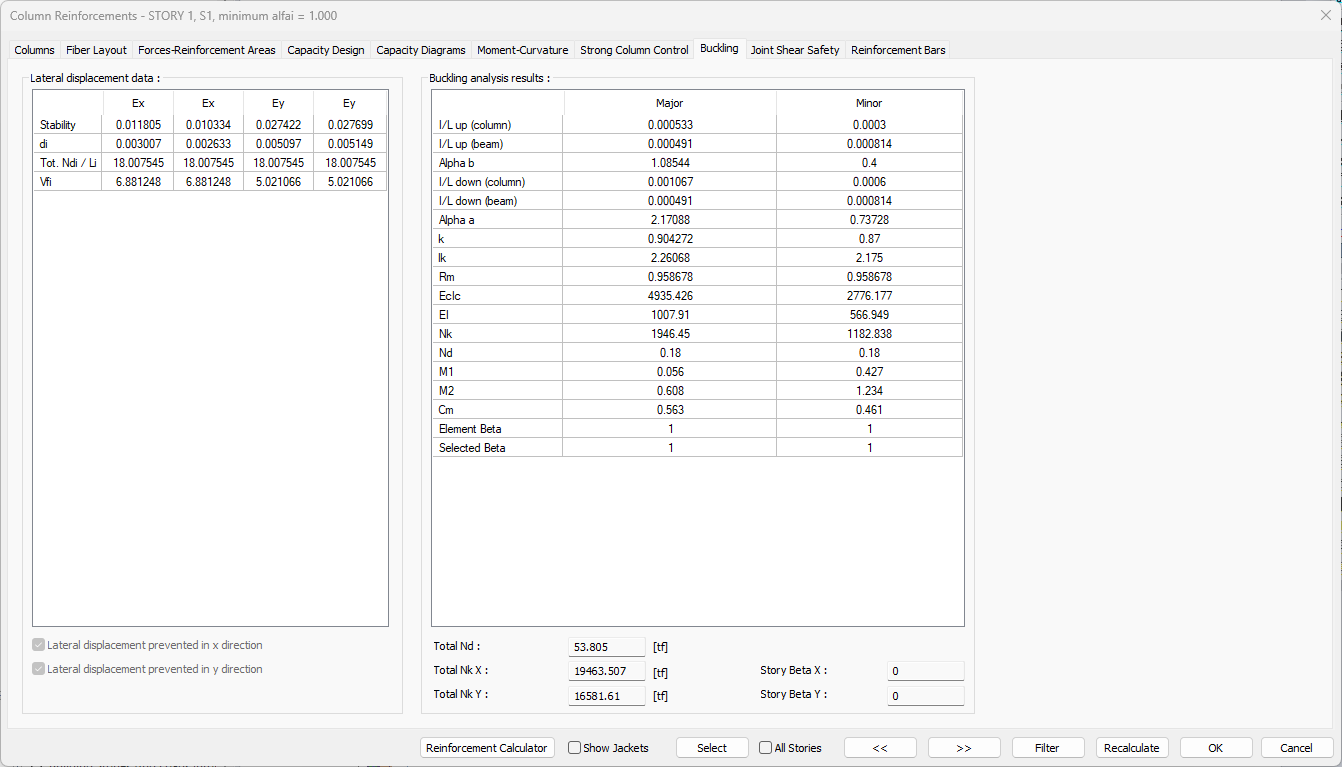
Buckling Tab
Column buckling calculations are made according to the moment augmentation method announced in February 2000 TS500. This tab provides detailed information about the account.
|
Specifications |
|---|
|
Lateral displacement data 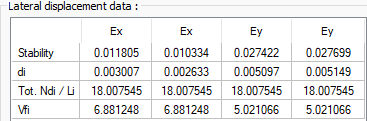
Stability: 1.5 di [total (Ndi / li) / vfi] <= 0.05
If the above condition is fulfilled, it is assumed that there is sufficient stiffness at that story and lateral displacement is avoided. Otherwise, it is assumed that the lateral translation has not been prevented. |
|
Lateral displacement prevented in x/y direction It is used to determine whether columns and stories in structures designated as being nonsway or sway. |
|
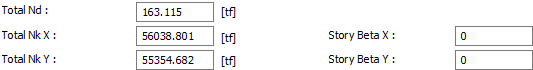
Buckling analysis results 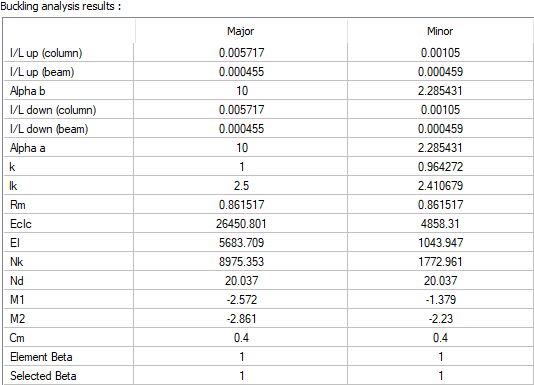
|
I/L up (column): Effective length ratio for columns connecting to the element top node.
|
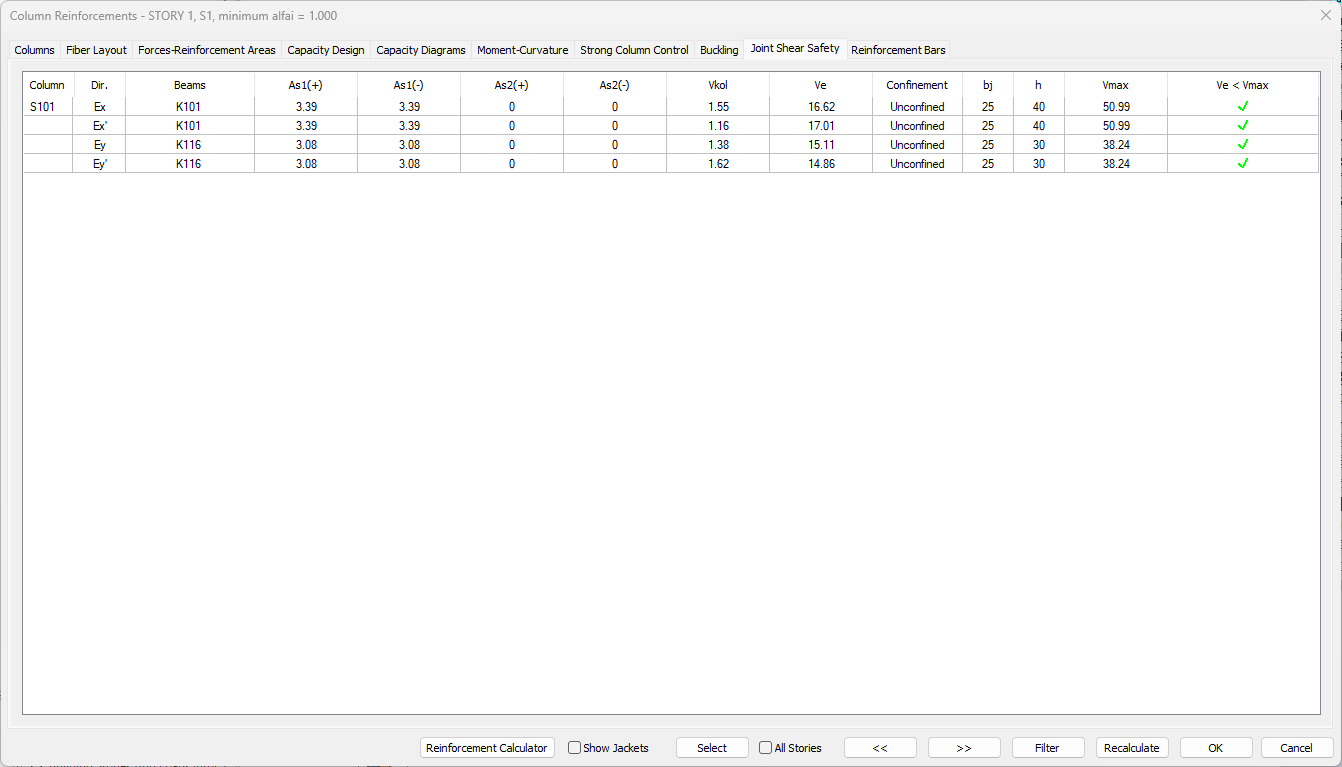
Join Shear Safety Tab
|
Specifications |
|---|
|
Column It is the name of the column under study that appears in the plan. |
|
Direction The earthquake loads applied with 5% eccentric in each direction are displayed as a line to indicate two different directions as horizontal x and vertical y. EX1, EX2; If EY1, EY2 are loaded with + and - 5% eccentric in the x-axis direction; Indicates earthquake loads with + and - 5% eccentric in the Y-axis direction. Column-beam shear safety calculations are made in 2 directions for 4 earthquake loading and details are listed. |
|
Beams 
A list of the beams attached to the column in the respective direction is given. For example, the beams seen on EX1, EX2 lines are the beams connected to the column in the x direction. Respectively, the 1st beam is on the left of the column and the 2nd beam is on the right of the column. Similarly, the beams that appear in the EY1 or EY2 lines are the beams connected to the column in the y direction, respectively, the beam in the 1st line is the beam connected from the bottom of the column, and the beam in the 2nd line is connected from the top of the column. |
|
As1, As2 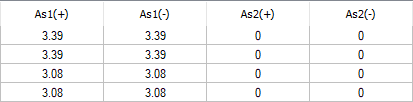
They are the values in cm2 of the reinforcements at the left or the ends of the beam, according to the direction of view, below or above the section. |
|
Vkol 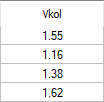
It is the smaller of the column shear forces calculated above and below the joint being controlled, separately for each direction and loading. |
|
Ve 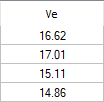
Including fyk steel yield strength; It is calculated from the formula V e = 1.25f yk (As 1 + As 2 ) - V arm . |
|
Confinement 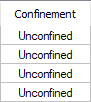
Joining of beams to column from four sides is defined as junction, confined junction if the width of each beam is not less than 3/4 of column width, and in other cases junction as unconfined joint. Whether the junction is enclosed or not does not indicate the insecurity of the junction, it determines by which formula the maximum shear force value Vmax will be found. |
|
bj In the direction of control, it is twice the smaller of the distance from the vertical middle axis of the beam stuck in the joint area to the column edges. (See: TBDY Figure 7.10) |
|
h It is the size of the column parallel to the direction of control. |
|
Vmax 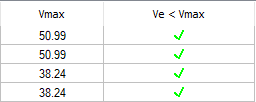
fcd, including concrete characteristic calculation strength;
|
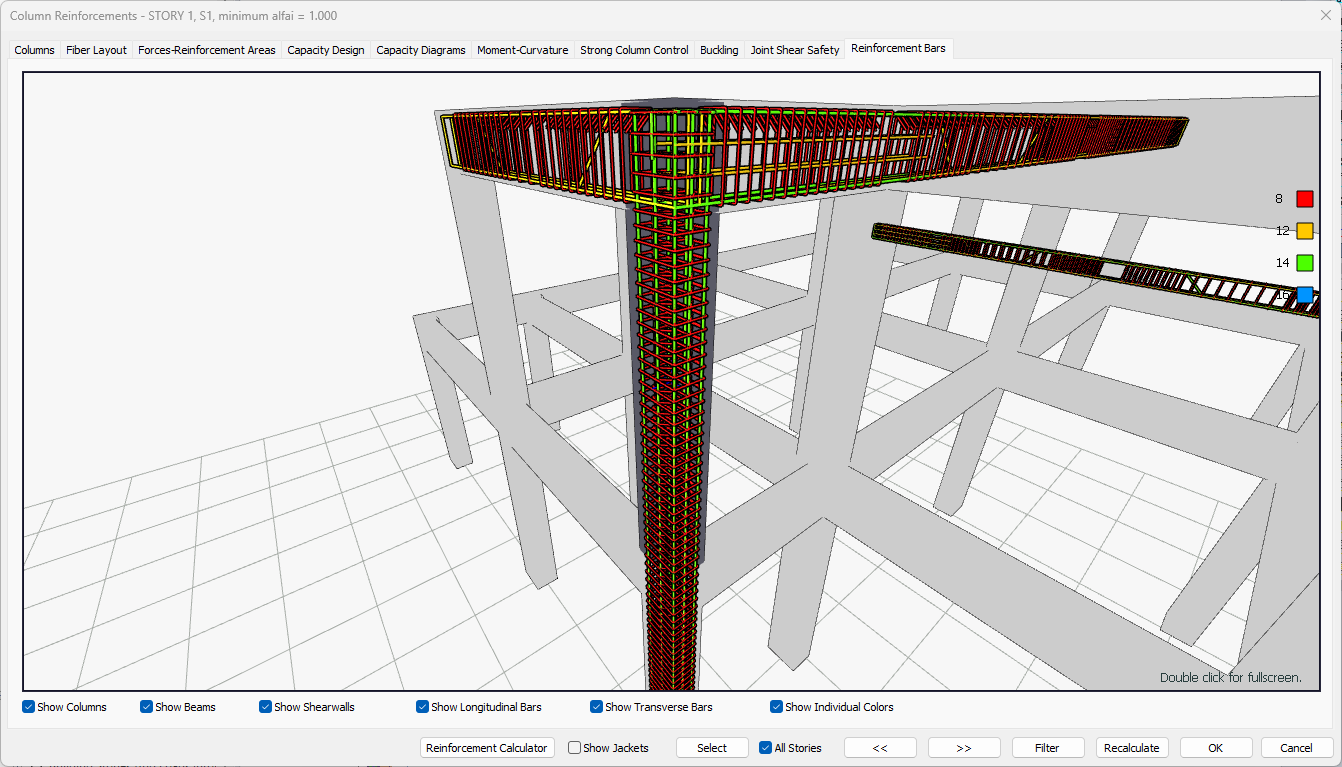
Reinforcement Bars Tab
|
Specifications |
|---|
|
3D image 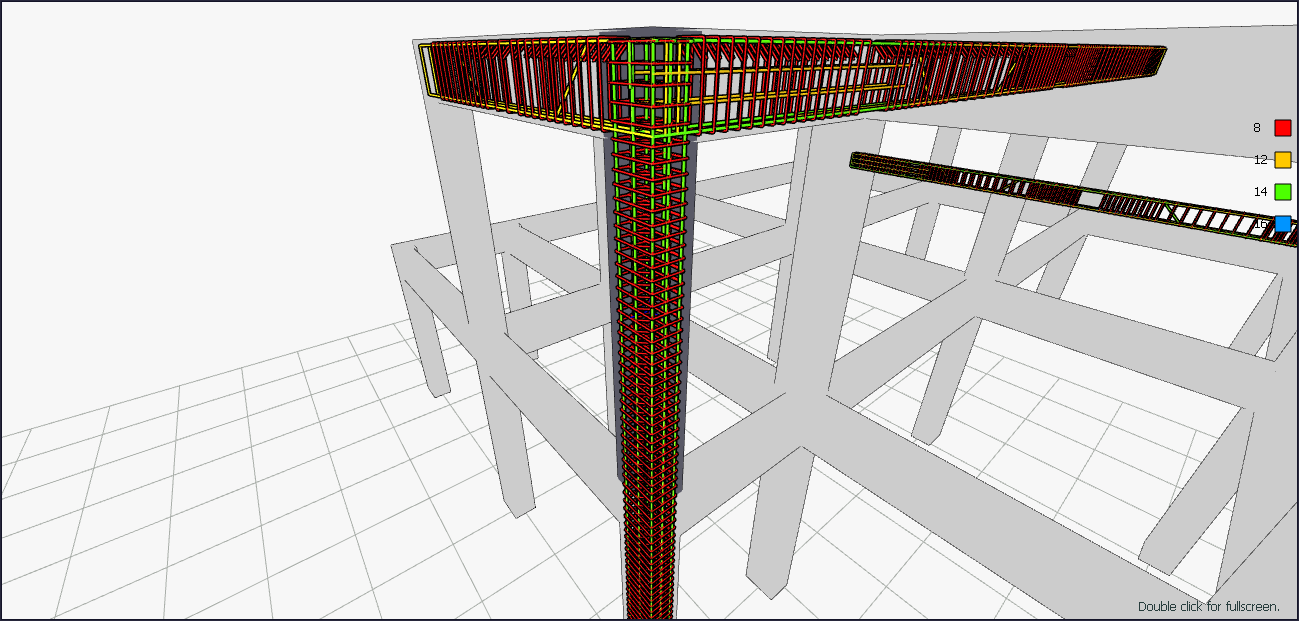
|
|
Show columns If the option is selected, column rebars are shown on the screen. |
|
Show beams If the option is selected, beam rebars are shown on the screen. |
|
Show shearwalls If the option is selected, shearwall rebar is shown on the screen. |
|
Show longitudinal bars Longitudinal bars of the elements with option marked are shown on the screen. |
|
Show transverse bars The transverse reinforcements of the elements with options are displayed on the screen. |
|
Show individual colors If the option is selected, bars with different diameters are shown in different colors. Which color represents which diameter is on the right of the screen. If the option is off, all of the rebars are shown in red. |
Next Topic
Related Topics