
Symbols
Ac = Gross cross-section area of the column
Ack = cross-sectional area of column measured to the outside edges of transverse reinforcement
Ash = total cross-sectional area of transverse reinforcement, including crossties, within spacing s and perpendicular to dimension, bk
bk = cross-sectional dimension of column core measured to the outside edges of the transverse reinforcement composing area Ash
bw = Width of the column in the direction of transverse reinforcement
fck = Specified compressive strength of concrete
fctd = Tensile design strength of concrete
fywk = Specified yield strength of the transverse reinforcement
Nd = Axial force calculated under the combined effect of vertical loads and earthquake loads factored by load combination
Ndm = defined for live loads in TS 498 Considering the live load reduction coefficients, G and Q joint effect of vertical loads and E earthquake effect G + Q + E , the largest axial pressure forces calculated under
s = Transverse reinforcement spacing, spiral / winding reinforcement pitch
ρ = Longitudinal reinforcement ratio
ϕ = Reinforcement diameter
E = Earthquake load effect
Q = Live load effect
G = Dead load effect
-
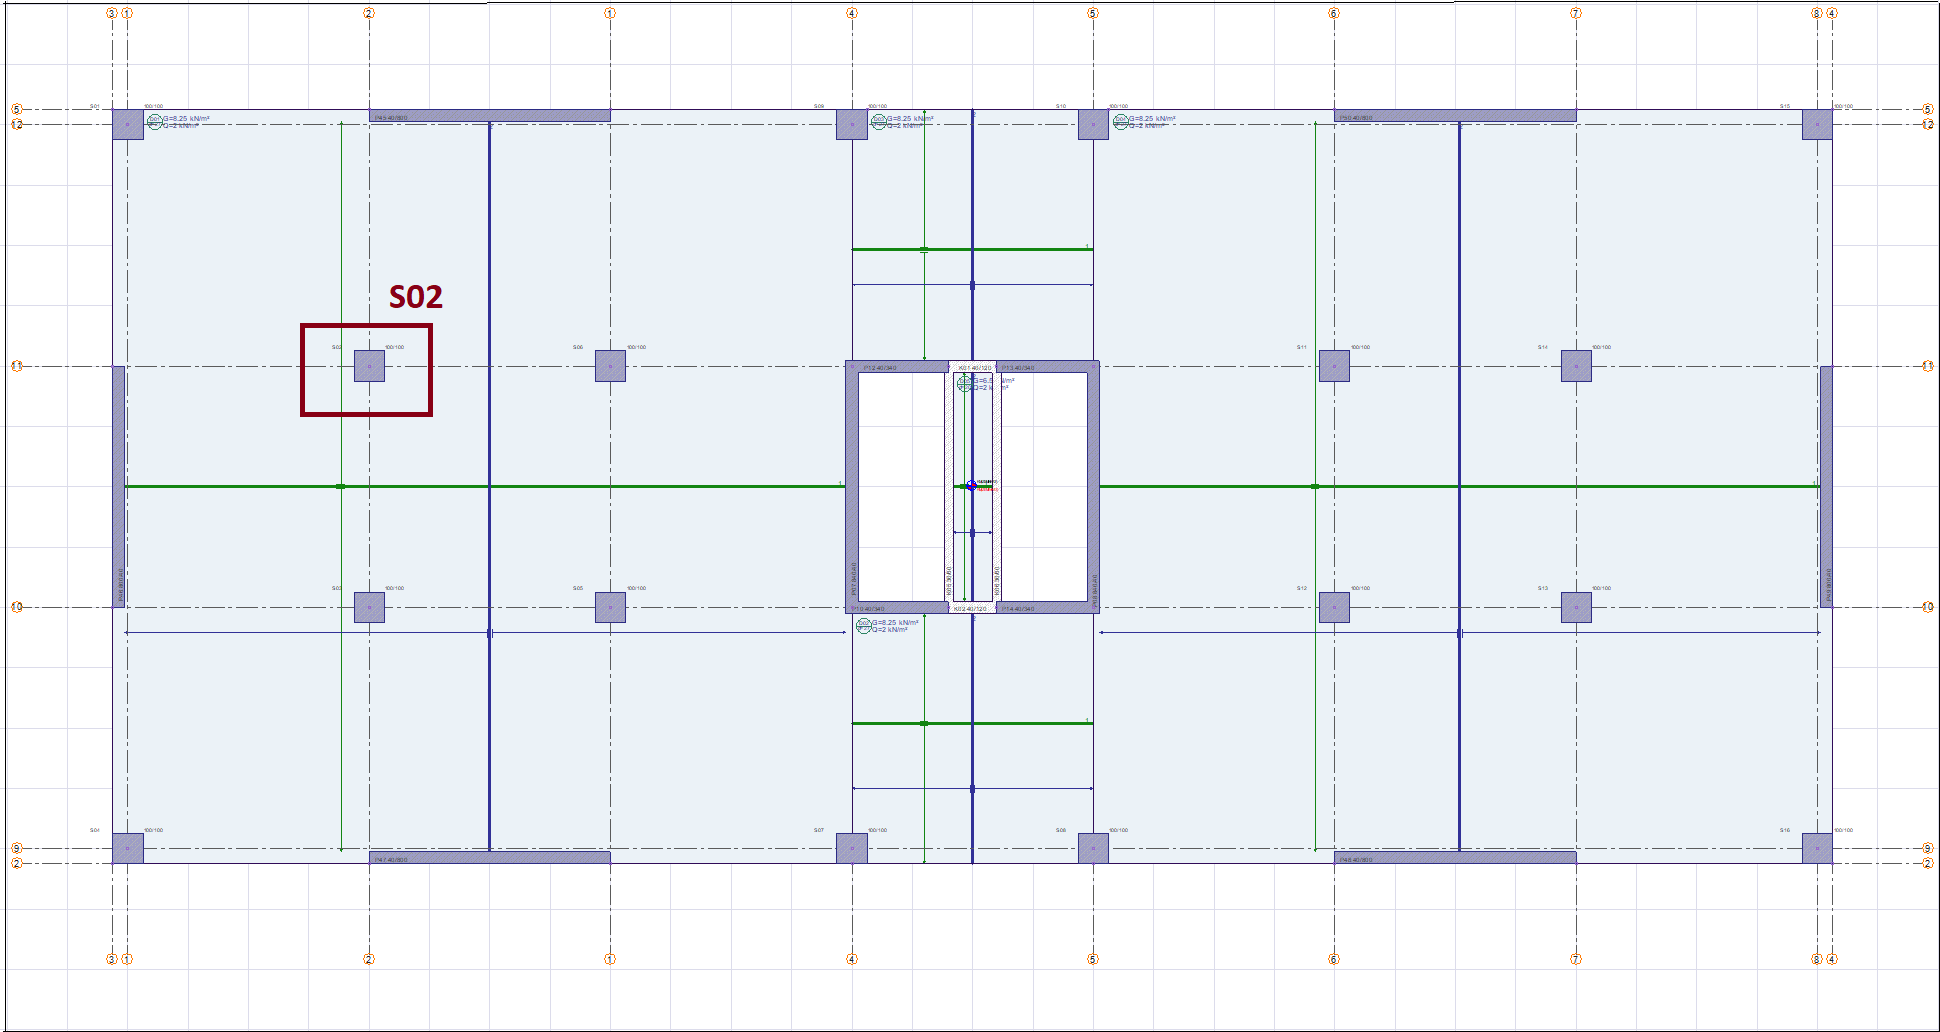
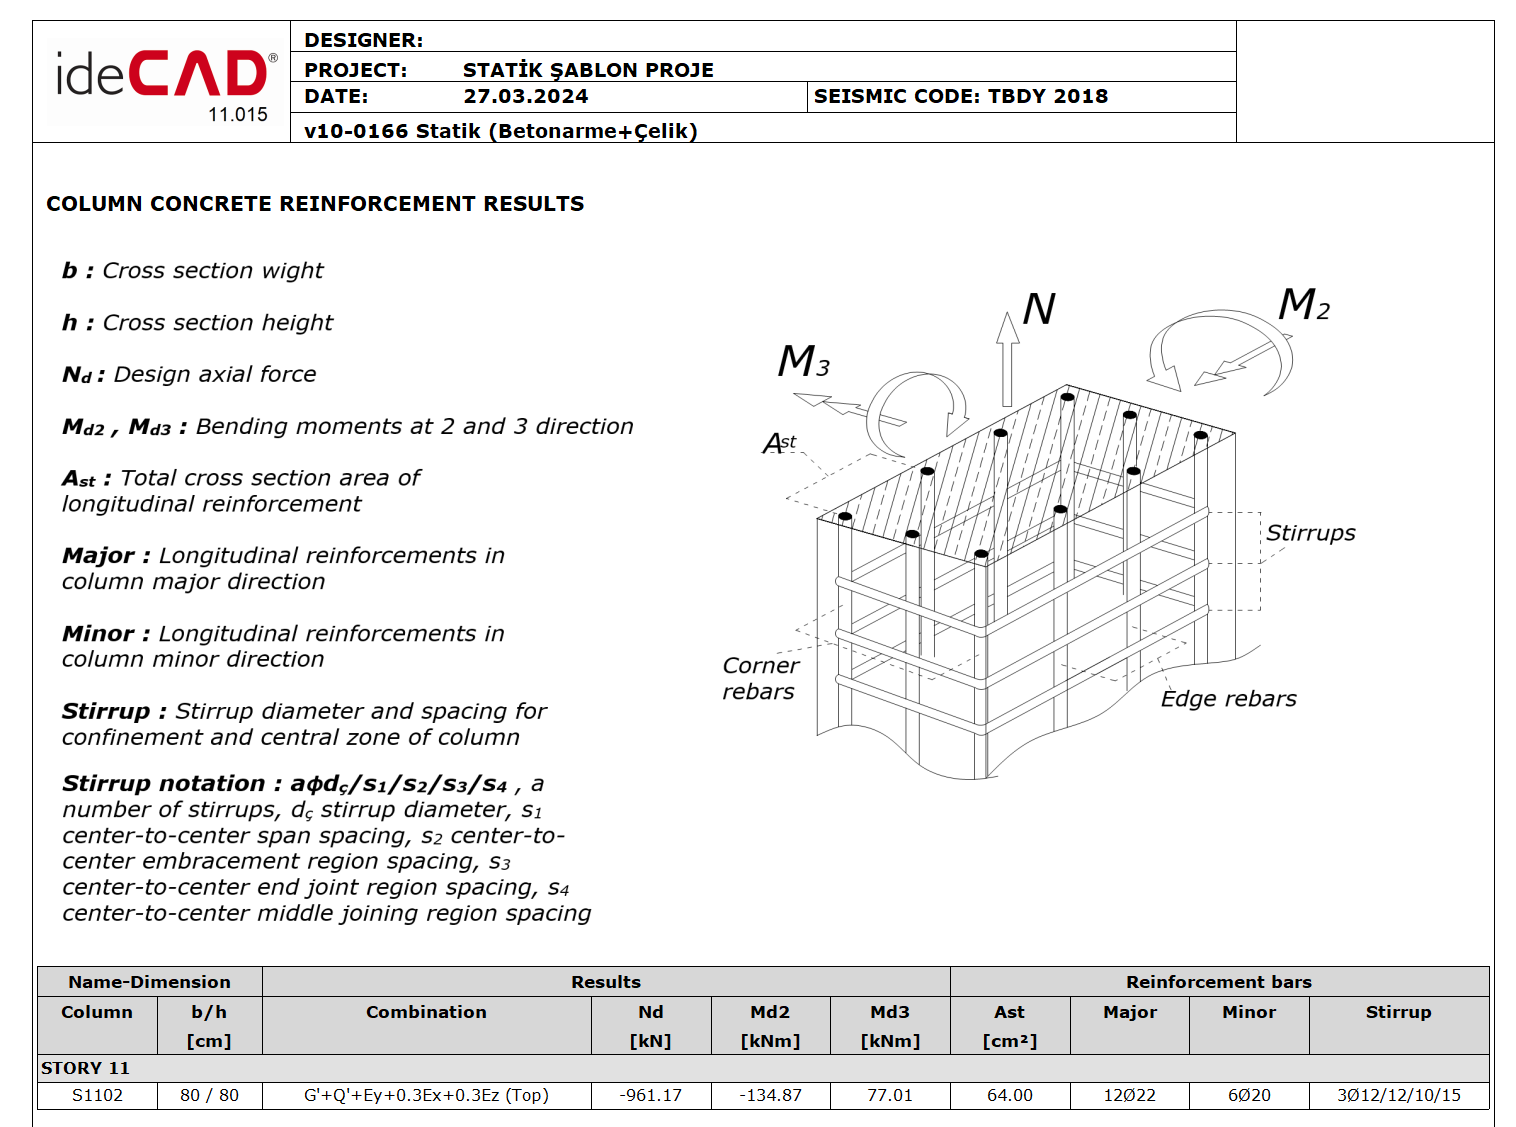
As an example, the S02 column on the 11th floor of the building will be shown. The S02 column is a structural element containing C35 B420C reinforcement with a cross section of 80 * 80 and the concrete cover is determined as 4 cm. The material model used in the calculation is as follows.
Column Axial Force Control
-
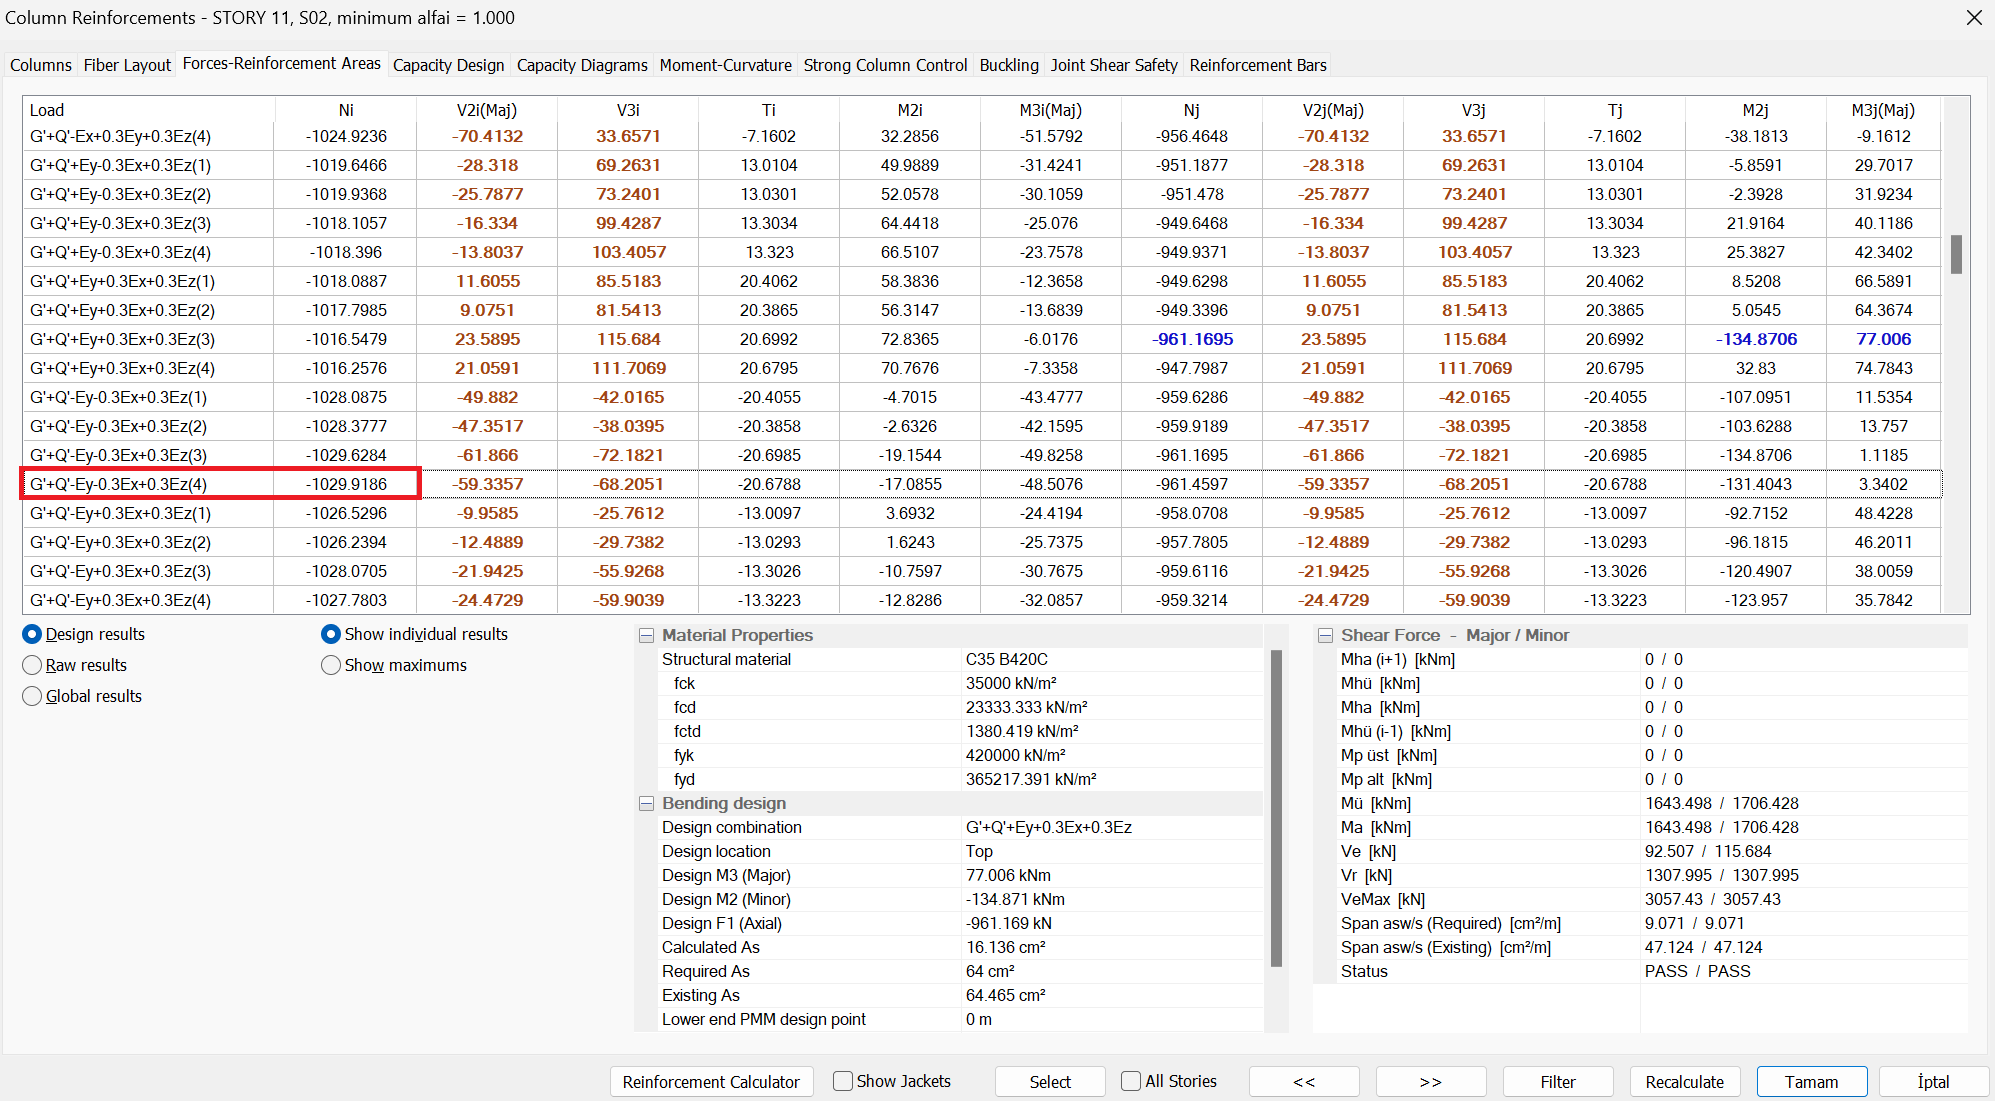
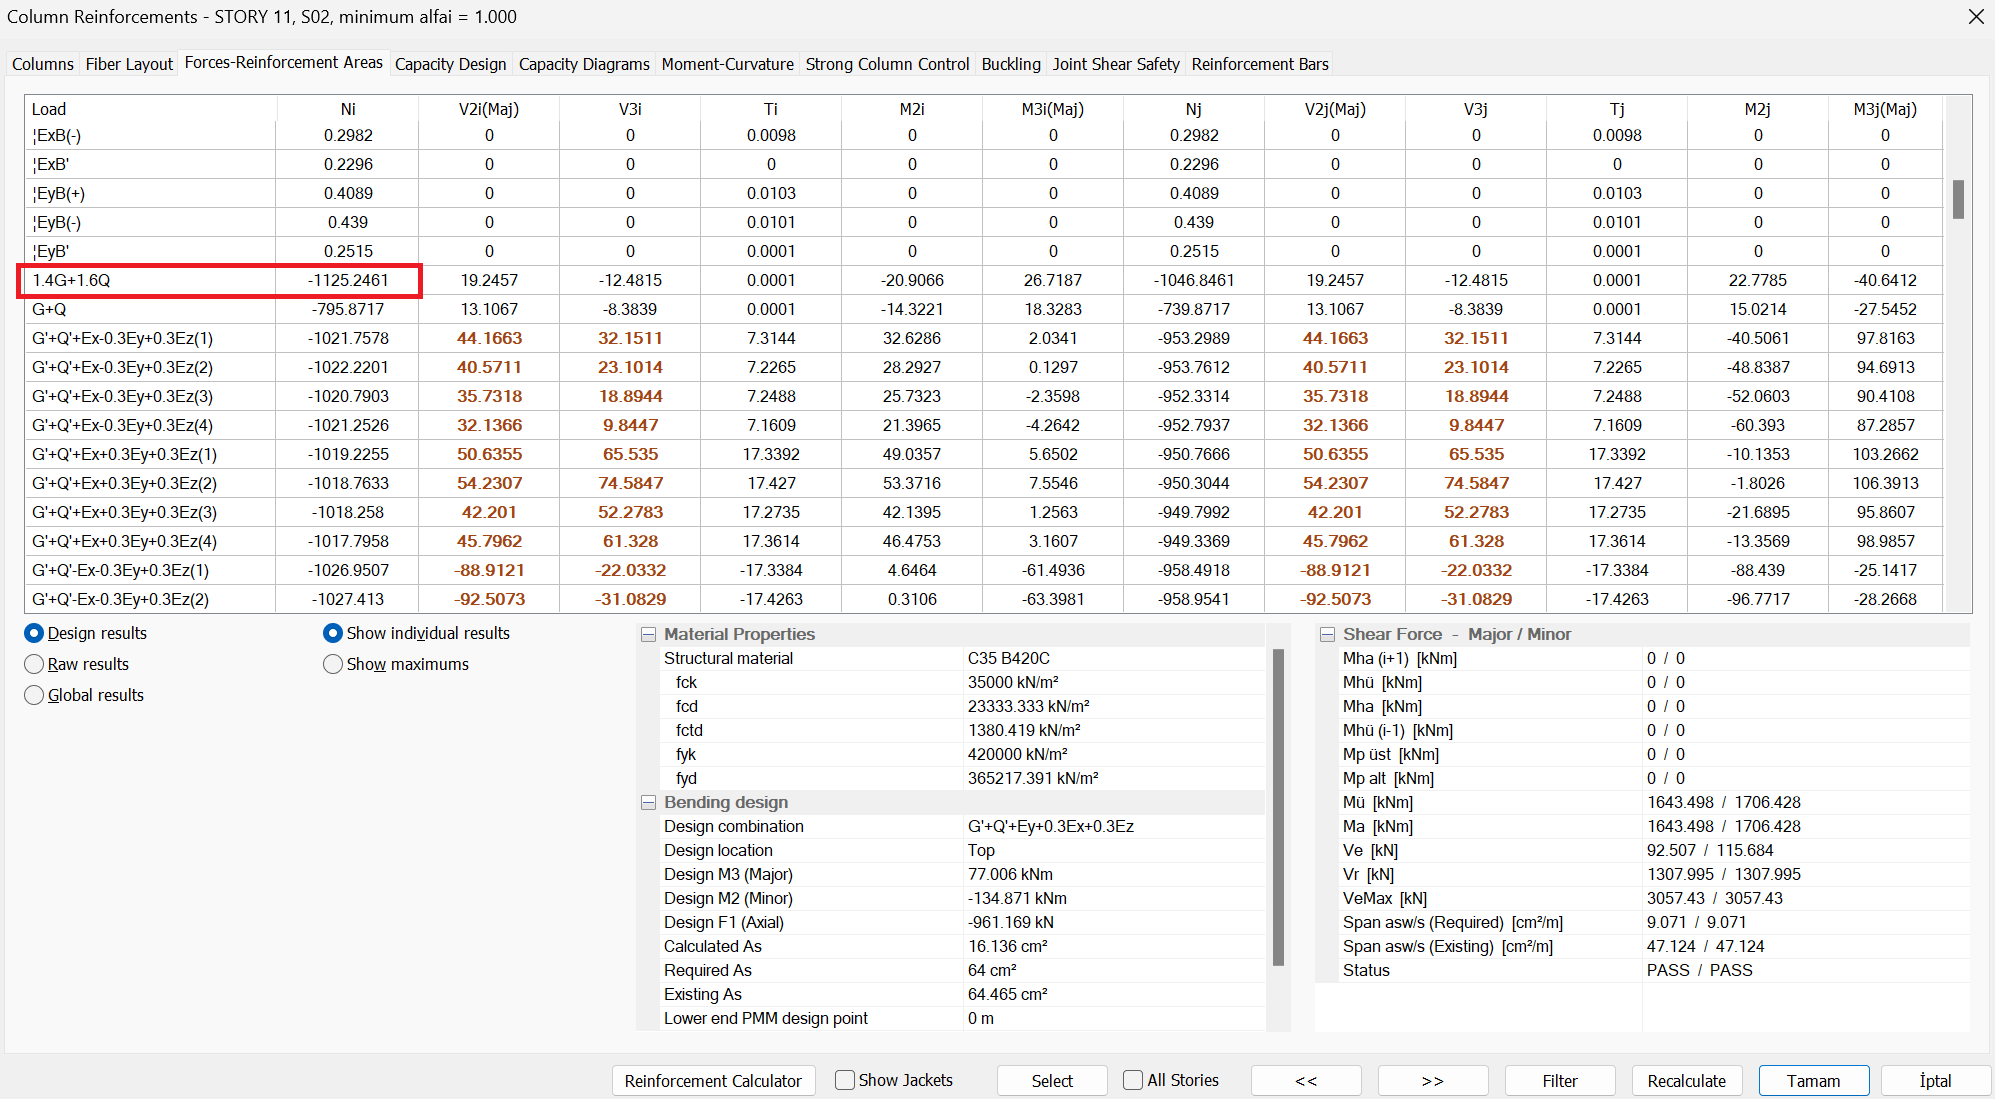
According to TBDY 7.3.1.2, the gross cross-section area of the column, Ndm, taking into consideration the live load reduction factor defined in TS 498, is the maximum of the axial compression forces calculated under the joint effect of vertical loads G and Q and E earthquake effect in case of G + Q + E loading. It should satisfy the condition Ac≥Ndm /(0.40fck ) using the larger one. It should also be provided under the control of TS 500 7.4.1.
-
In the program, in the reinforced concrete design - columns tab, all loading combinations for the 11th floor S02 column under the heading Forces-Reinforcement areas are examined, and it is determined that the greatest axial compression force occurred for the G+Q +E case and 1.4G+1.6Q for all loading combinations.
-
We can check whether the forces we get from the program meet the conditions as follows.
-
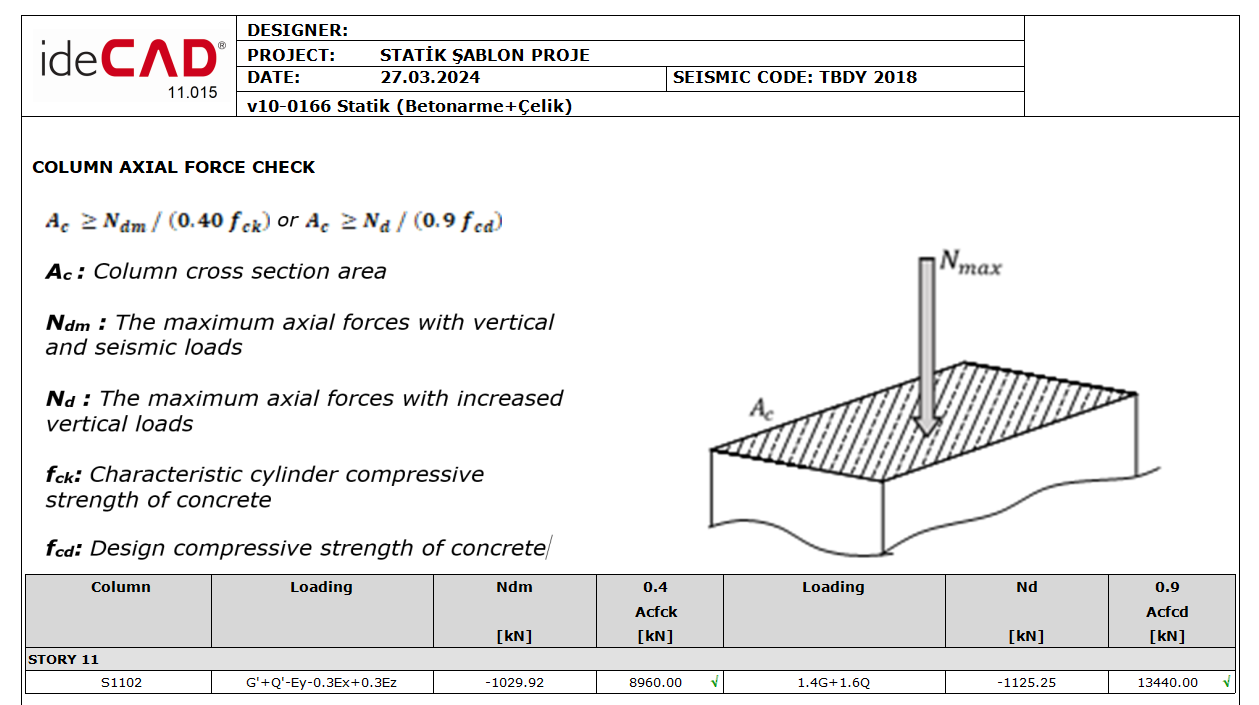
In the column report obtained from the program below, the control included in TS 500 7.4.1 is summarized, as well as the TBDY 7.3.1.2 control.
-
Within the TS 500, the largest axial compressive force will be selected from among loading combinations. For TS 500, there is no requirement that the load combination contain an earthquake.
-
It can be seen that the calculated values are compatible with the report.
Determination of Column Transverse and Longitudinal Reinforcement
-
In accordance with TBDY 7.3, the minimum longitudinal reinforcement and transverse reinforcement of the column element we consider as an example will be determined first. The element strengths obtained with these reinforcements will be compared with the design forces obtained from the calculation. If the strength values are smaller than the design forces, the required reinforcement will be revised and the required element strength will be obtained.
-
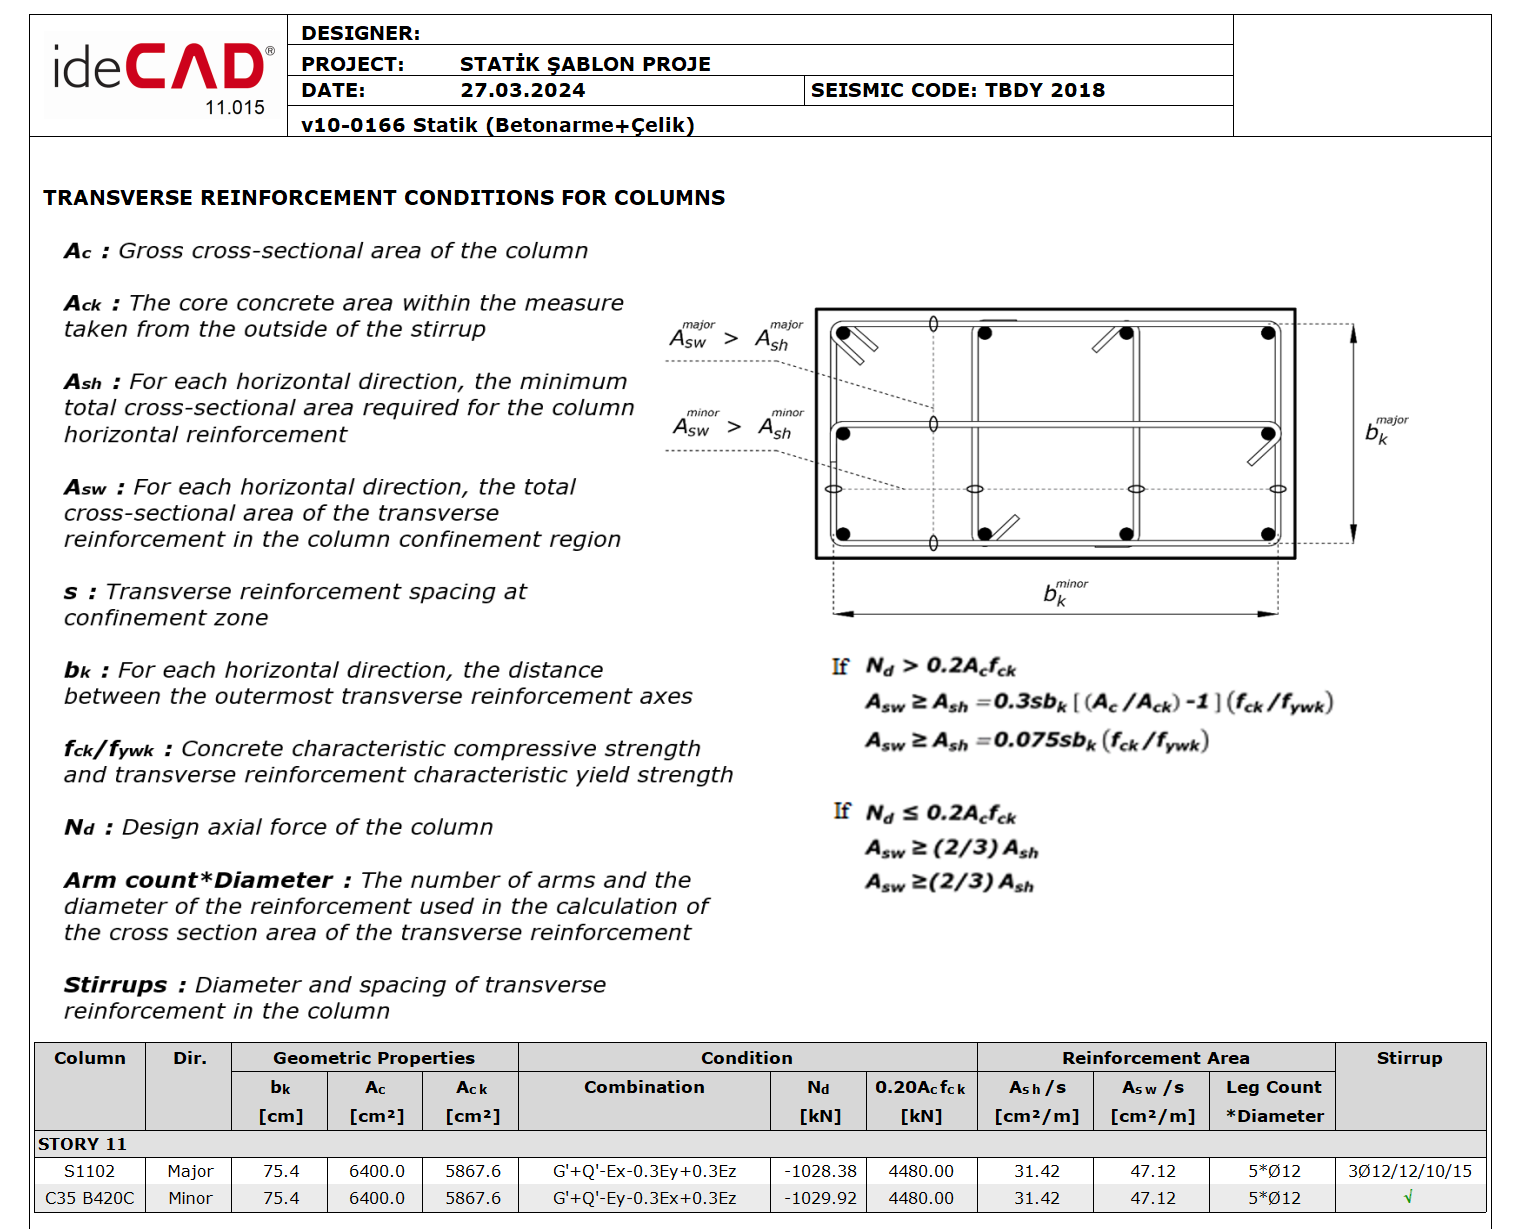
In accordance with TBDY 7.3.4.1 article, in the case of Nd < 0.20Acfck (compression), the minimum total transverse reinforcement area in the confinement zones is calculated in such a way that the unfavorable conditions are given below.
-
Below are the calculations for the S1102 column.
Transverse reinforcement required in the coiling area max (Ash,1 / s, Ash, 2 / s) = 31.42 cm2/m
5 legs for column transverse reinforcement Asw = 565.49 mm2
The stirrup spacing selected on the vertical is 120 mm (TBDY 7.3.4.1)
-
The minimum area of longitudinal reinforcement in columns cannot be less than 1% of the gross section. (TBDY 7.3.2.1)
-
The suitability of the recommended reinforcement for minimum transverse and longitudinal reinforcement has been checked below.
Column Transverse Reinforcement Control
-
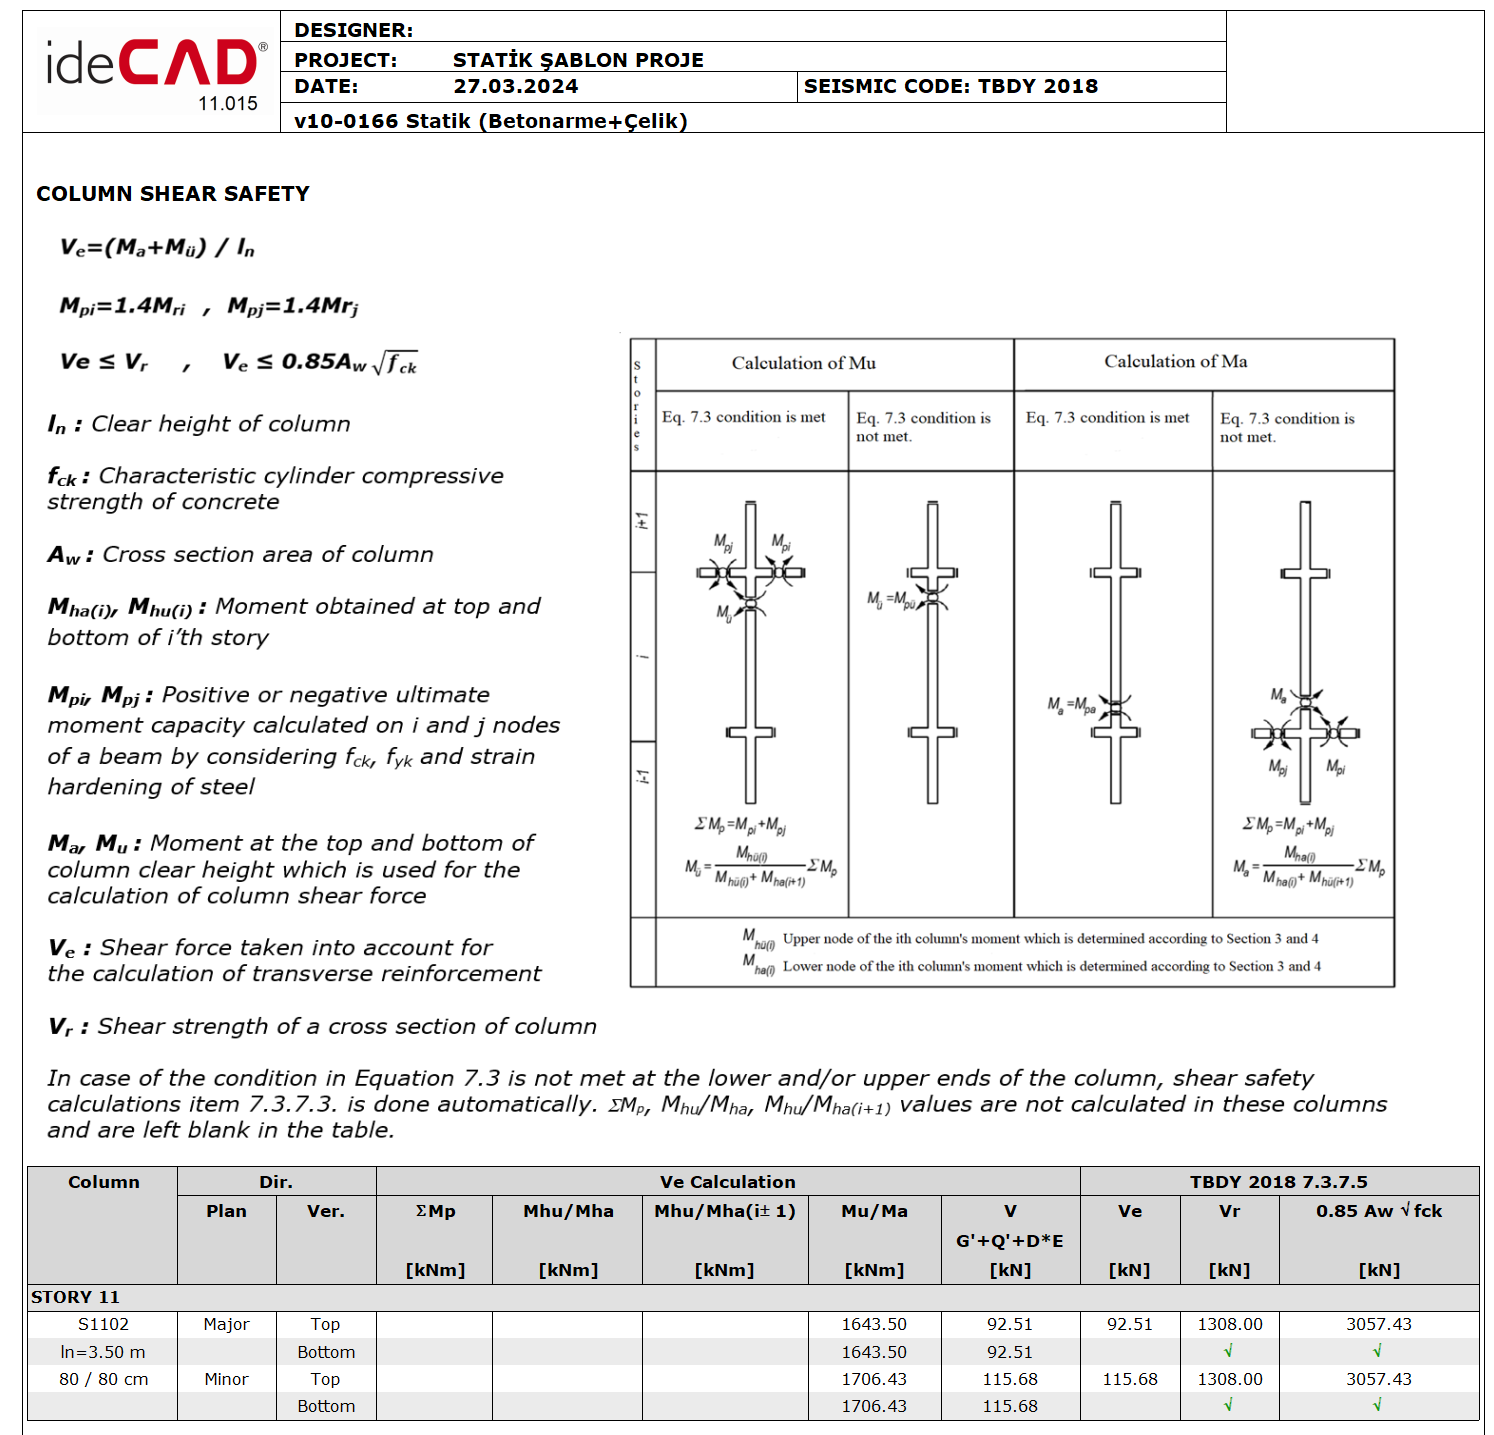
According to TBDY 7.3.7.5, the shear force Ve, which will be taken as the basis in the calculation of the transverse reinforcement of the columns, is used as the Resistance Excess Coefficient, D, together with the vertical loads, and the shear force calculated from the earthquake Vd and must also meet the following conditions.
-
In the calculation of the column transverse reinforcement according to the shear force, Vc, the contribution of concrete to the shear strength will be determined according to TS 500. However, in accordance with TBDY 7.3.7.6, in the calculation of the transverse reinforcement in the column confinement regions, if the shear force consisting only of seismic loads is greater than half of the total shear force in seismic condition and at the same time, if the condition N d ≤0.05A c f ck is fulfilled, the contribution of concrete to shear strength is Vc = 0 is taken.
-
As a result of the above conditions, Vc = 0, and the shear contribution of concrete will not be used in calculations.
-
The column reports in the table above are from the shear reinforcement section. Manual control matches the report.
Column Reinforcement Control
-
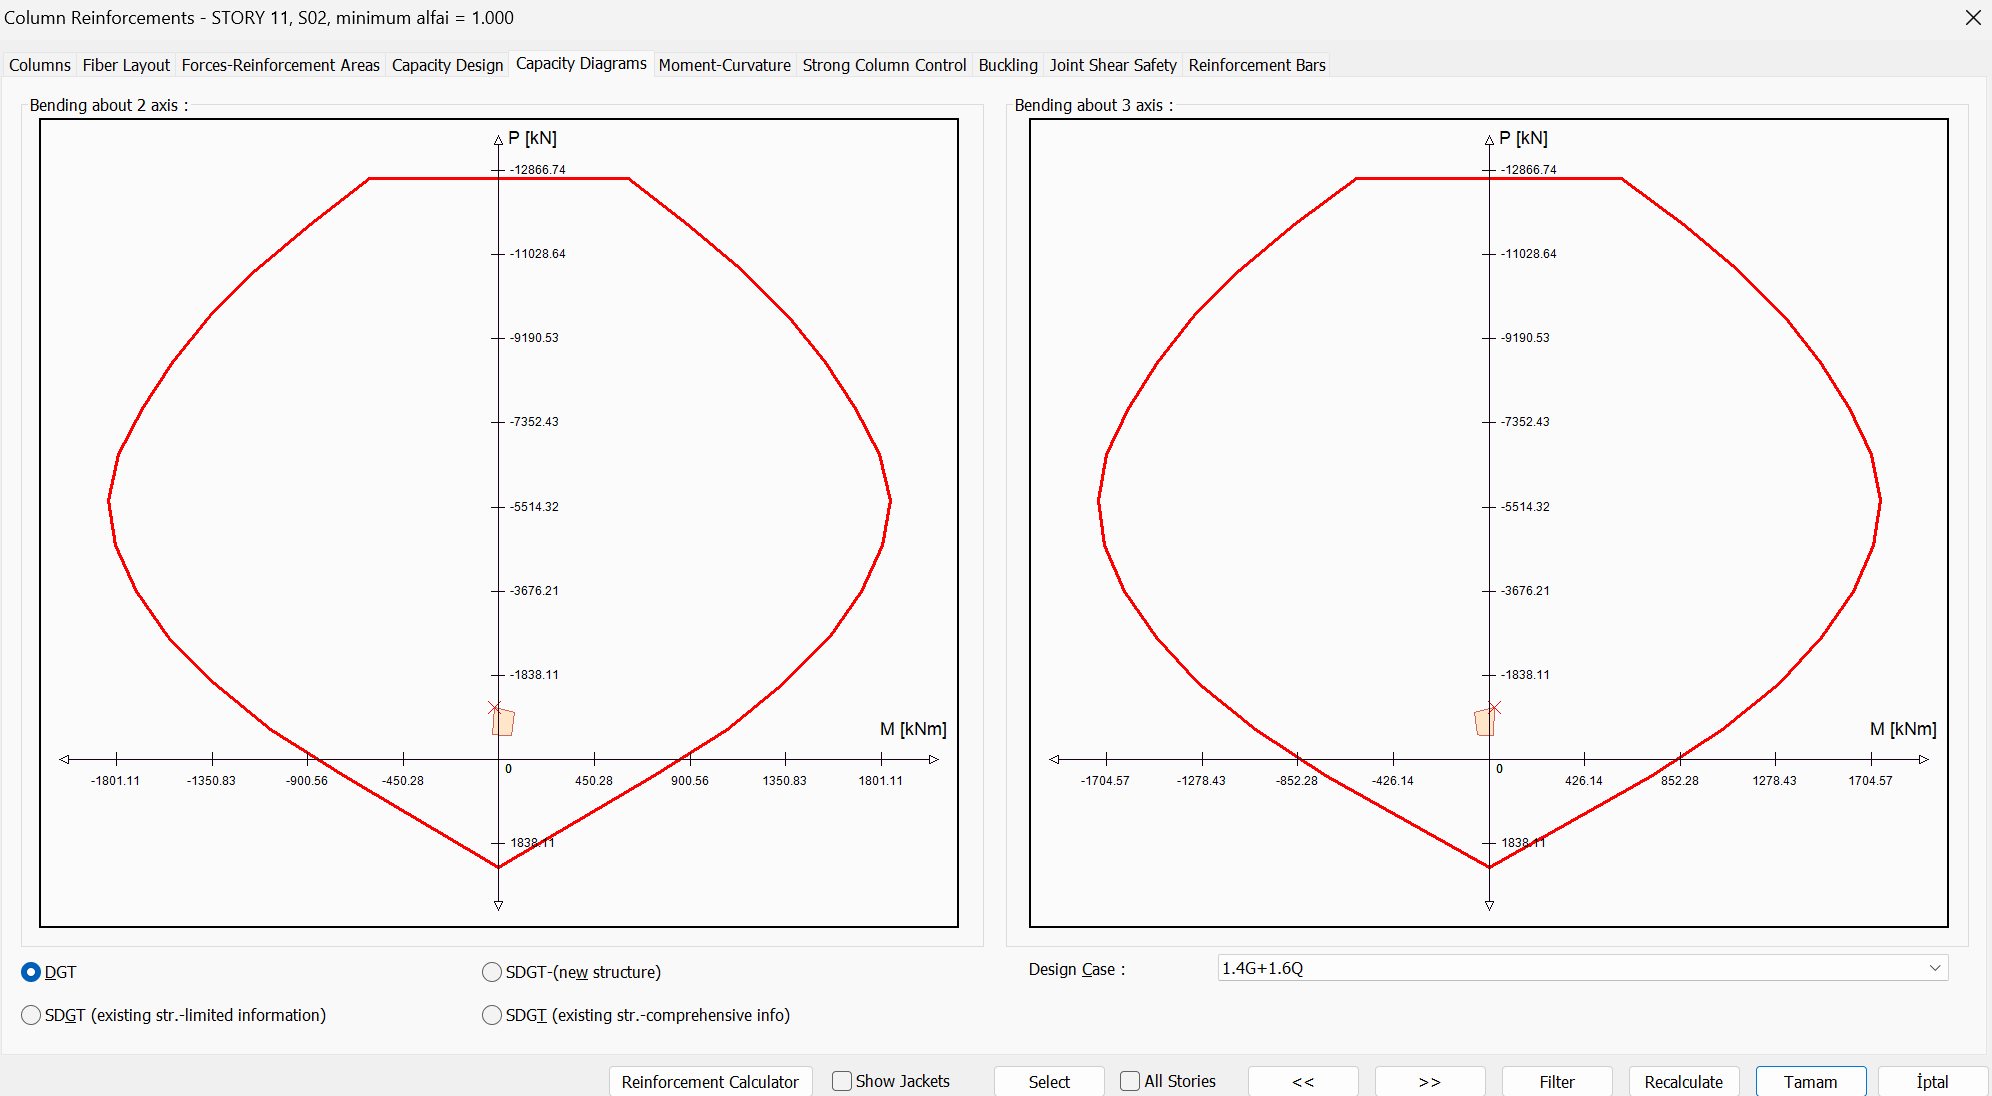
The M2-M3 interaction diagram was obtained against the normal force obtained for each load combination under the joint effect of vertical and earthquake loads in the design on the yield surface created for the projected column longitudinal reinforcements. It is checked whether the moment values obtained at the lower and upper ends of the column remain in this diagram. The amount of longitudinal reinforcement foreseen in accordance with TBDY 2018 7.3.2.1 provides the design values obtained from the calculations.
-
Below are the results of the capacity diagrams section obtained from the ideCAD Structural.
-
P-M2-M3 diagrams can be checked under all loading combinations on the program interface. The moment values obtained at the upper and lower ends of the column remain in the diagram.
-
In the column report, reinforcement areas are given with the relevant forces in the reinforced concrete section.
Next Topic