
Beam reinforcement design results and insufficiency conditions for beams are displayed in the Beam Reinforcements dialog. In the beam reinforcement dialog, beam transverse and longitudinal reinforcements (span and support reinforcements), internal forces calculated as a result of the analysis, increased internal forces related to TBDY, capacity ratios, deflection and crack control results are given. Beam reinforcements are changed and fixed in the Beam Reinforcements dialog.
Location of Beam Reinforcements Dialog
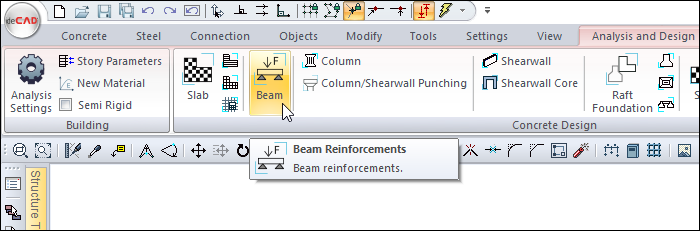
After analysis, you can access it by clicking on the Beam Reinforcements command under the Concrete Design title of the ribbon menu Analysis and Design tab .
General Specifications of Beam Reinforcements Dialogue
|
Summary Information The summary information about the line where the cursor is located is given in the form of Story, Name, and Position in the name of the dialog. 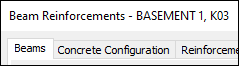
For example, Basement 1, K03 |
|
Using the Shift key In this tab, you can select more than one row with the Shift key, enter a value by double-clicking any cell whose value is open to change, and make that value apply to all selected rows. |
|
Using the Ctrl key Ctrl key, on the other hand, selects the lines in between one by one. |
|
Reinforcement calculator Calculates the amount of rebar, in area, for the selected diameter and span. |
|
Select Selects the object on the line with the cursor. When the concrete dialog is closed, you can take action for the selected element. |
|
All Stories It lists the slabs on the screen throughout the entire story. |
|
Previous The cursor moves to the previous line. |
|
Next The cursor goes to the next line. |
|
Filter It is used to define certain conditions and filter only the elements that satisfy that condition. |
|
Recalculate The element rebuilds its concrete. The regulation calculations related to concrete and rebars are also made again. It may be more appropriate to repeat the structure analysis instead of concrete in important changes. |
|
Ok It saves the changes made and closes the dialog. |
|
Cancel Closes the dialog without saving the changes made. |
Insufficiency Code Description and Recommended Solution
|
Insufficiency Code |
Description |
|---|---|
|
K |
Shear safety is not ensured.
|
|
M |
Maximum reinforcement ratio is exceeded.
|
|
S |
Deflection exceeds allowable limits according to the Design Code.
|
|
N |
Axial load condition Nd ≤ 0.1·Ac·fck is not met, and the beam is not treated as a column.
|
|
n |
Nd > 0.1·Ac·fck condition is met, and the beam is detailed as a column. Informational only; no action needed if proper detailing is done. |
|
Ç |
Crack width exceeds limits as per the Design Code.
|
|
ab |
Anchorage length is insufficient (Seismic Design Code).
|
|
Br |
Torsional reinforcement is insufficient.
|
|
As(-) |
Provided reinforcement area is inadequate.
|
|
D |
Balanced reinforcement ratio is not achieved.
|
|
R |
The capacity ratio under axial force and biaxial bending exceeds 1.0.
|
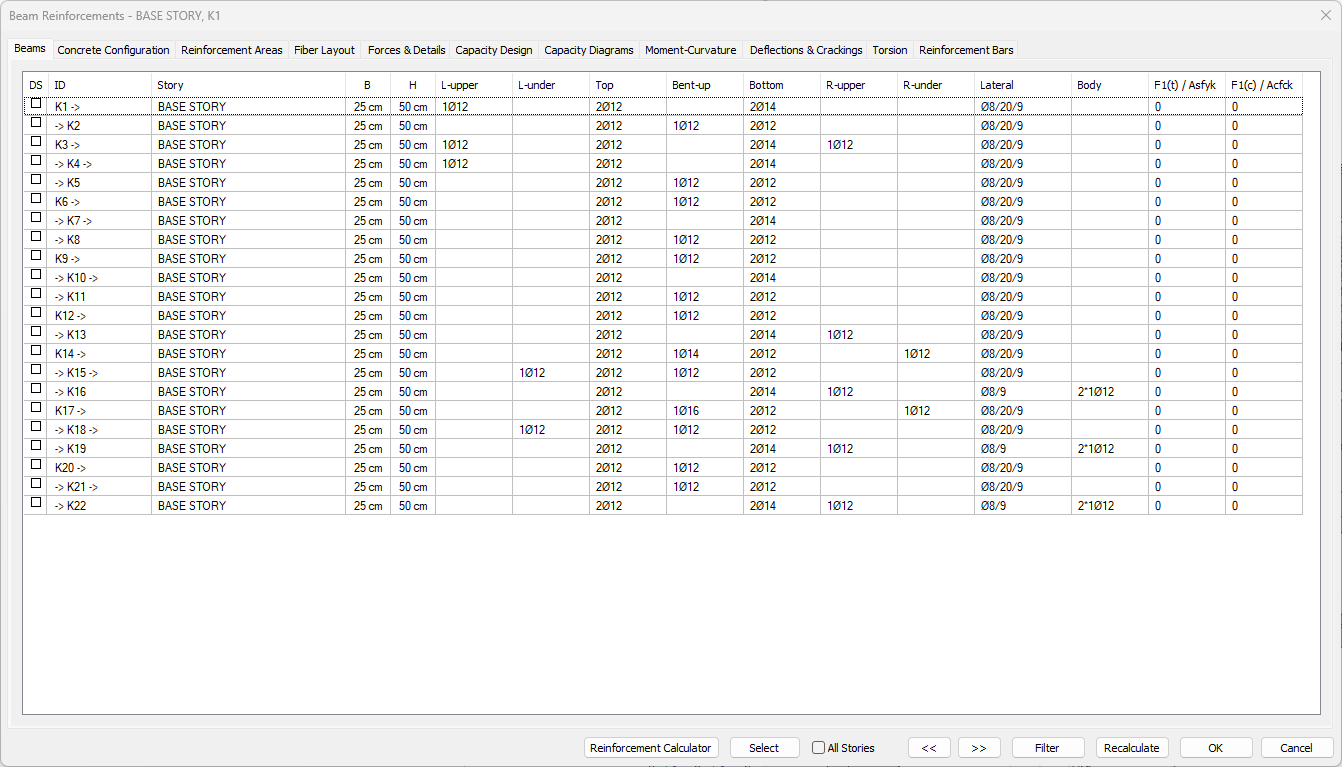
Beams Tab
In this tab, the list of beam dimensions and rebar is given as a table.
|
Specifications |
|---|
|
DS It is the rebae fixing column. If marked, the rebar is fixed. DS is automatically marked when changes are made in beam rebar, and when concrete is made, the beam rebar also remains constant. If DS is not marked, when concrete is made, beam rebars are determined again according to rebar selection conditions. |
|
ID 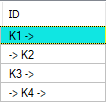
It is the name of the beam in the plan. (K1, K101, K10 etc.) In case of negativity, the term related to negativity is added next to the name. Like K101 (M). |
|
Story 
The name of the story where the beam is located appears in this cell. |
|
B, H 
It is the width and height of the beam, respectively. You can change the dimensions by double clicking in the B and H cells. When the size is changed, the beam rebar calculation is made for that beam according to the changed dimensions. |
|
L-upper 
It is the value in terms of number and diameter of the rebar located on the left support section of the beam. You can make changes by double-clicking the cell. |
|
L-under 
It is the value of the rebar under the left support section of the beam in terms of number and diameter. You can make changes by double-clicking the cell. |
|
Top 
It is the value of the beam assembly rebar in terms of number and diameter. You can make changes by double-clicking the cell. |
|
Bent-up 
It is the value of beam pleating rebar in terms of number and diameter. You can make changes by double-clicking the cell. |
|
Bottom 
It is the value of beam straight rebar in terms of number and diameter. You can change by double clicking the cell. |
|
R-upper 
It is the value of the rebar on the right support section of the beam in terms of number and diameter. You can make changes by double-clicking the cell. |
|
R-under 
It is the value of the rebar under the right support section of the beam in terms of number and diameter. You can make changes by double-clicking the cell. |
|
Lateral 
It is the diameter and spacing of the beam stirrup in the middle zone and densification zone, respectively. You can make changes by double-clicking the cell. |
|
Body 
It is the value of the beam body rebar in terms of number and diameter. You can make changes by double-clicking the cell. |
|
F1(t)/Asfyk 
The ratio of the axial tension force to axial tesion limit. |
|
F1(c)/Acfck
The ratio of the axial compressive force to axial compression limit. |
Concrete Configuration Tab
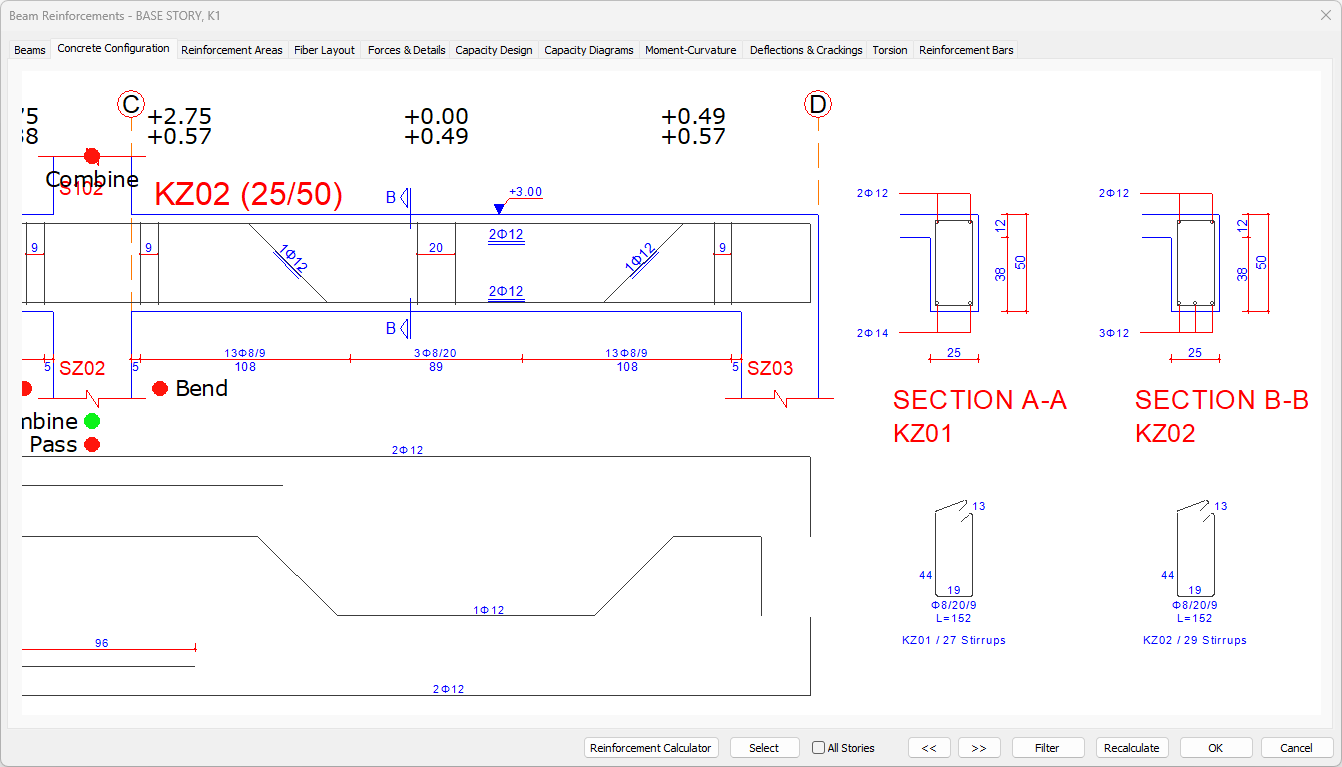
In the concrete configuration tab, the beam drawing appears. You can shift the drawing left and right by holding down the left mouse button.
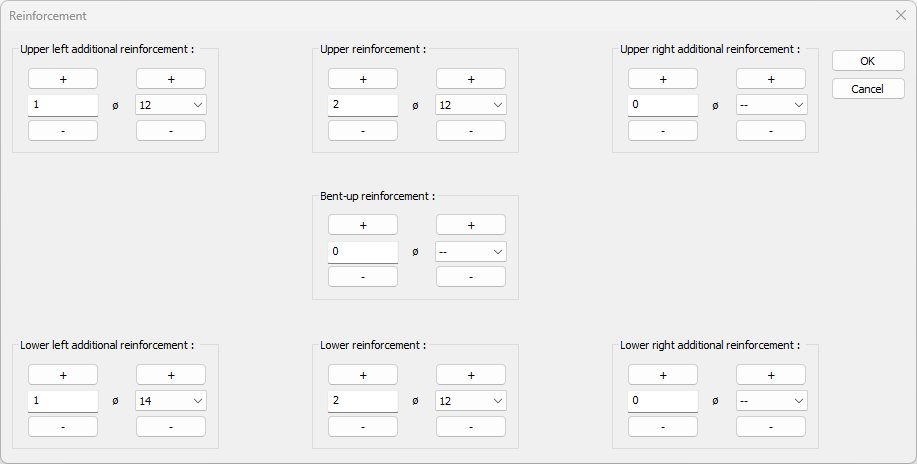
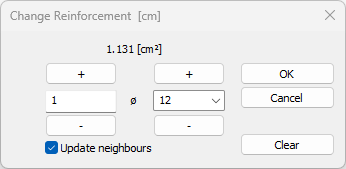
When you left click on the beam text indicating the name of the beam (K1 25/50 etc.), a dialog showing the reinforcements opens. In this dialog, the rebar diameter and/or quantity of the beam can be changed.
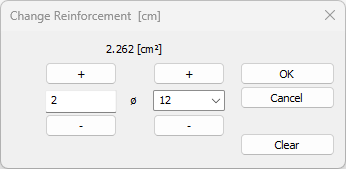
The same can be done by clicking on any rebar text value on the drawing. In this case, a dialog opens in which only the clicked rebar will be changed.
Update neighbours: This option is important if the rebar being replaced is a rebar that is shared with neighboring beams. If the option is selected, the rebar in the adjacent support is automatically changed.
In the concrete configuration, especially the green and/or red circles that appear on the supports of continuous beams determine where the beam reinforcements are to be cut.
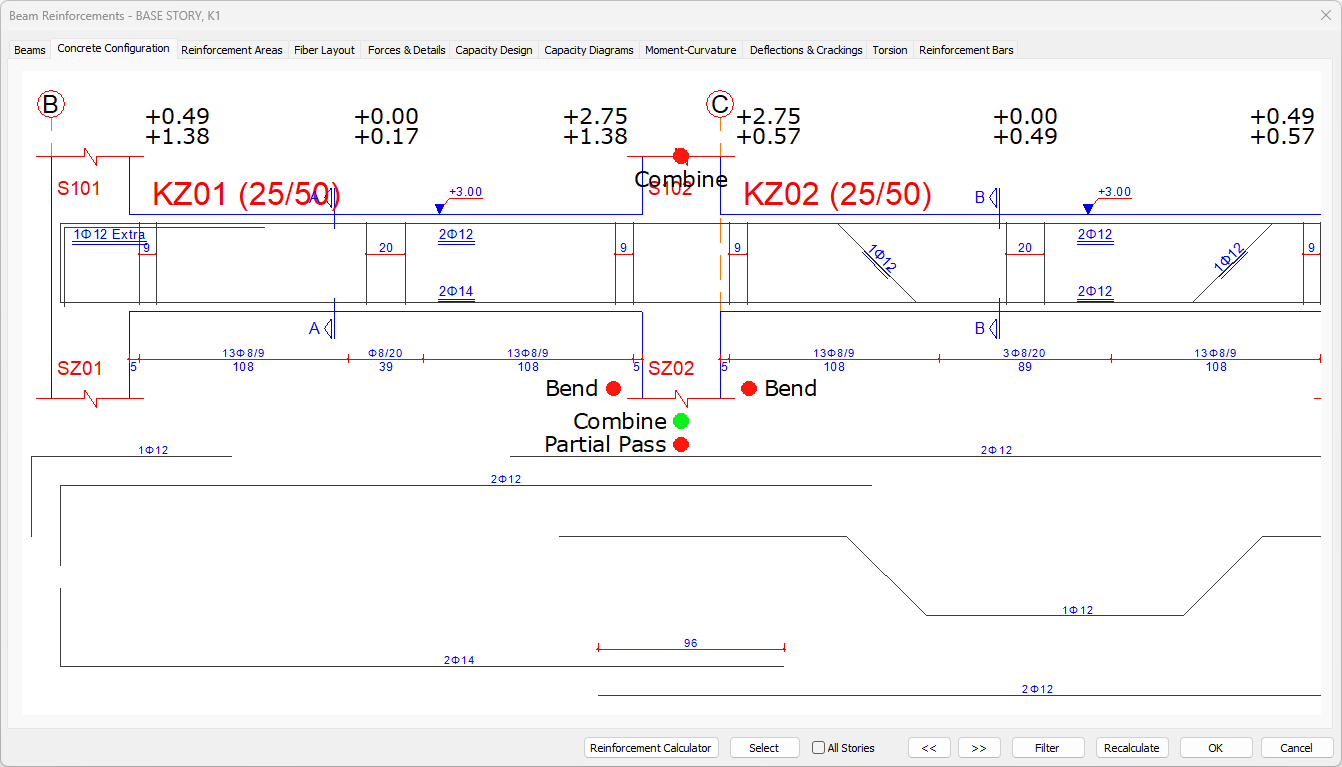
If the circle is green, the rebar is continued to the next span. If the circle is red, the reinforcement is cut at the support.
Circles are turned into red and / or green (rebar passes / does not pass) by clicking with the mouse. According to the rebar cutting status, the rebar arrangement is made automatically, excess or missing rebars can be viewed on the screen. Missing reinforcements are transmitted to the user in red.
Bend: If it is green, it means that the rebar will be cut with a set square. Red means that the rebar will be left straight or continue to the adjacent beam.
Partial pass: Partial pass is active in green, inactive in red. This option, which is set for continuous but different beams, regulates whether a certain proportion of the rebar will be transferred to the other beam. In two continuous beams of different widths, if this option is selected, the rebar pass is arranged by taking into account the ratio found from the division of the width values of the adjacent beams. For example, let the width of the 1st beam 50 cm and the width of the 2nd beam 25 cm. 25/50 = 0.5 ratio. The number of rebar, for example, is 4 flat rebar 2 pieces of rebar will make partial pass, and 2 pieces of rebar will be cut with a square.
Combine: If the beam is continuous, the continuous beams automatically have the same continuity and the reinforcement is drawn continuously up to the maximum rebar length value (12 meters). So this option is automatically green. If the option is deselected (made red), the canceled beam will not be drawn continuously, but detached from the adjacent beam at the common support.
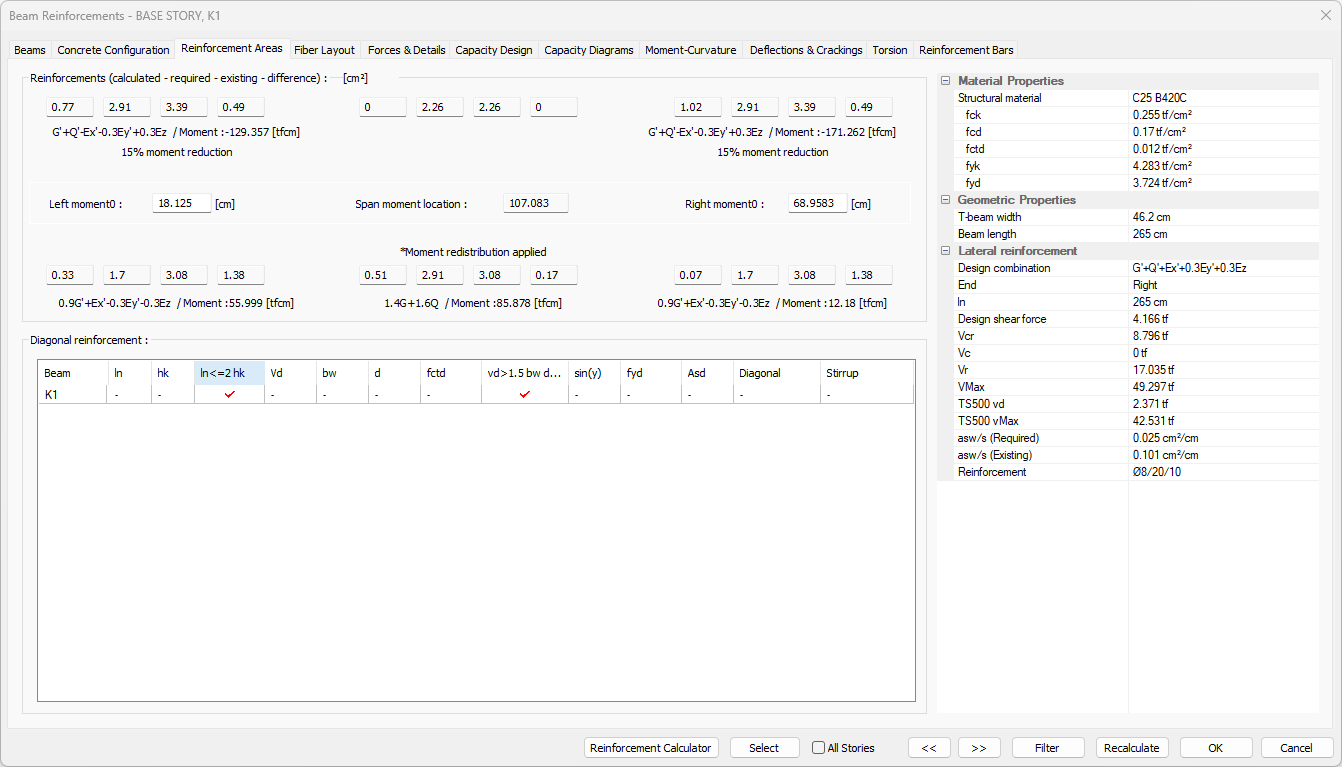
Reinforcement Areas Tab
|
Specifications |
|---|
|
Accessories section (calculated - required - existing) 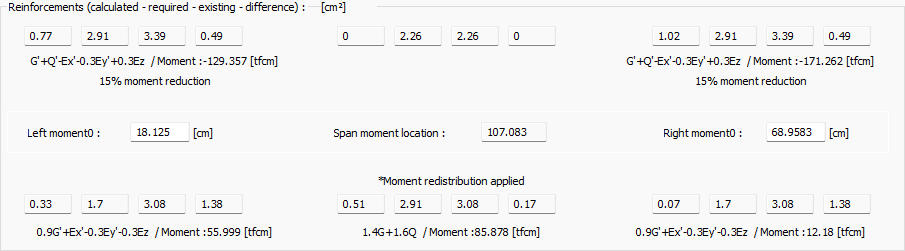
At the left support of the beam, upper and lower; in the middle; clearance and mounting; in the right bracket; The sum of the calculated-required-existing-difference reinforcement areas is given as top and bottom. Just below, the loading combination of the reinforcement calculation and the moment values of that combination are also written. Left moment0: At the beam left support, the moment zero point is the distance from the left end of the beam. The value can be changed if desired. In the beam details, the break distance of the battery is taken as the value written here. Right moment0: At the beam right support, the moment zero point is the distance from the right end of the beam. The value can be changed if desired. In the beam details, the break distance of the battery is taken as the value written here. |
|
Structural material Shows the structural material of the beam. |
|
fck The characteristic of concrete is its compressive strength. |
|
fcd The characteristic calculation of concrete is its compressive strength. |
|
fctd The characteristic calculation of concrete is its tensile strength. |
|
fyk Reinforcement is the yield strength of rebar. |
|
fyd It is the calculation strength of rebar steel. |
|
T-Beam width Beam is the plate value. It is the beam width value in rectangular sections. (b) In symmetrical sections;
For unsymmetrical sections,
For a, the following values can be used:
Upper limits
or
|
|
Beam length Shows the beam length. |
|
Design combination And the loading that gives its value is the name of the combination. |
|
End Support for cutting calculation ... (left or right) |
|
ln It is the net span value of the beam from inside the column to the inside of the column, from the beam edge to the beam edge if the beam is supported to another beam. |
|
Design shear force It is the design shear force used in stirrup calculation. In beams of high ductility level;
|
|
Vcr It is the shear force that creates the oblique crack.
|
|
Vc It is the shear force carried by concrete.
|
|
Vr It is the maximum cutting force value that the section can carry. The design shear force Ve used in stirrup calculation is not allowed to exceed Vr. The method followed in the calculation of Vr:
|
|
Vmax It is the maximum shear force that the section can carry.
|
|
TS500 vd Design shear force determined according to TS500. |
|
TS500 vMax Maximum shear force that the section can carry, determined according to TS500. |
|
asw/s asw / s It is the area of 1 meter of single arm stirrup found for densification zone as a result of shear force calculation. And it is calculated. And = Vdy ± (Mpi + Mpj) / ln If And> Vmax or Ve> Vr, the cross section is insufficient. And Asw / s is calculated from the formula of = (Asw / s) * fywd * d + 0.8 Vc. S is accepted as 1 meter. And if - Vdy> = 0.5 Vd then Vc = 0 is taken. The asw / s value is never allowed to be less than 0.3 (fctd / fywd) * bw. |
|
Reinforcement It is the stirrup rebar selected from the Asw / s value. It is shown as the number of stirrups, the diameter of the rebar, the middle and the spacing in the densification region, respectively. |
|
Diagonal reinforcement 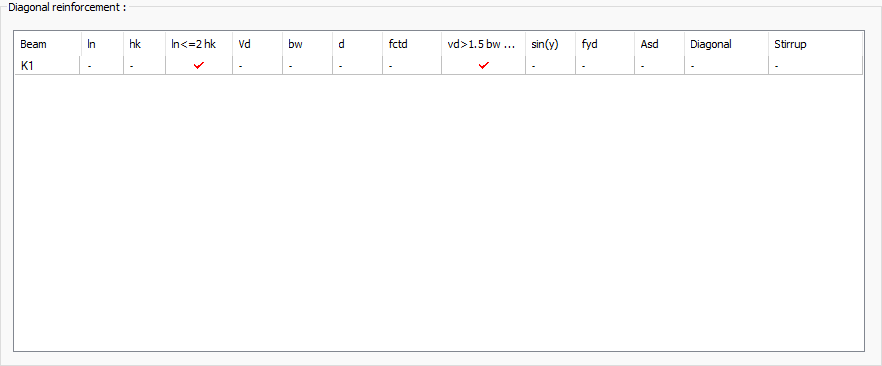
Lists the control information in table form of the diagonal rebar design related information in the tie beams. (TBDY Article 7.6.8) Ln> 2hk and V <= 1.5 bw d fcd checks are made. Asd = Vd / (2fydsin (y)) ln: Beam clear span
d = hk-spacers fctd: Concrete characteristic calculation tensile strength
|
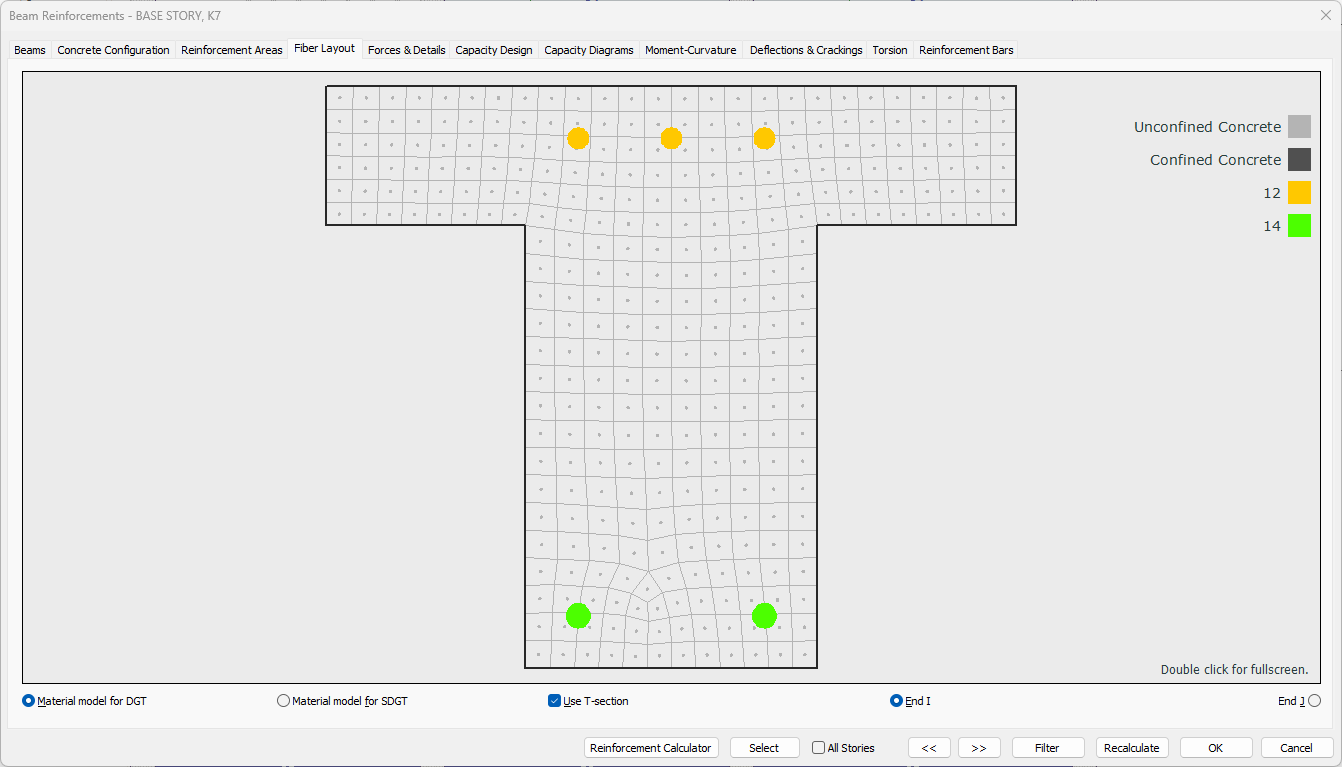
Fiber Layout Tab
|
Specifications |
|---|
|
Preview and legend 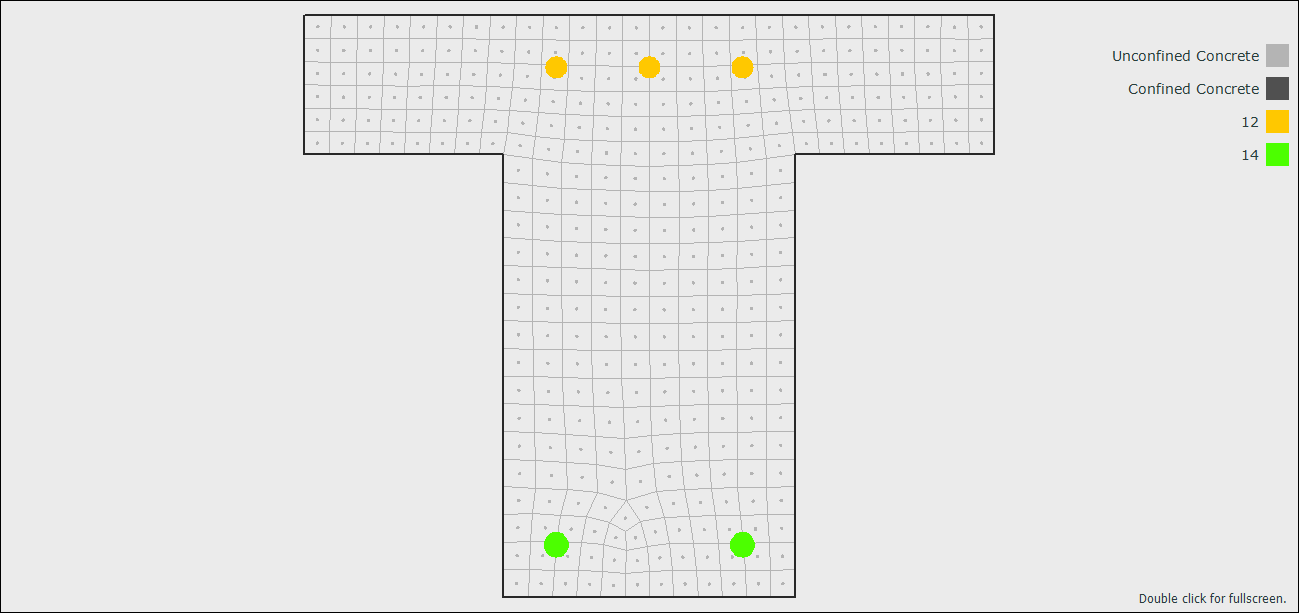
The fiber layout preview and what the colors mean are shown. |
|
Material model for DGT Section cells and rebars are displayed according to the concrete and rebar material model criteria defined in TS500. |
|
Material model for SDGT The section cells and rebars are displayed according to the SGDT criteria for the concrete and rebar material model defined in TBDY. |
|
Use T-section If the option is selected, t-section is used. |
|
End I Shows the arrangement of fibers and reabers at the i-end of the beam. |
|
End J Shows the fiber and rebar arrangement at the j end of the beam. |
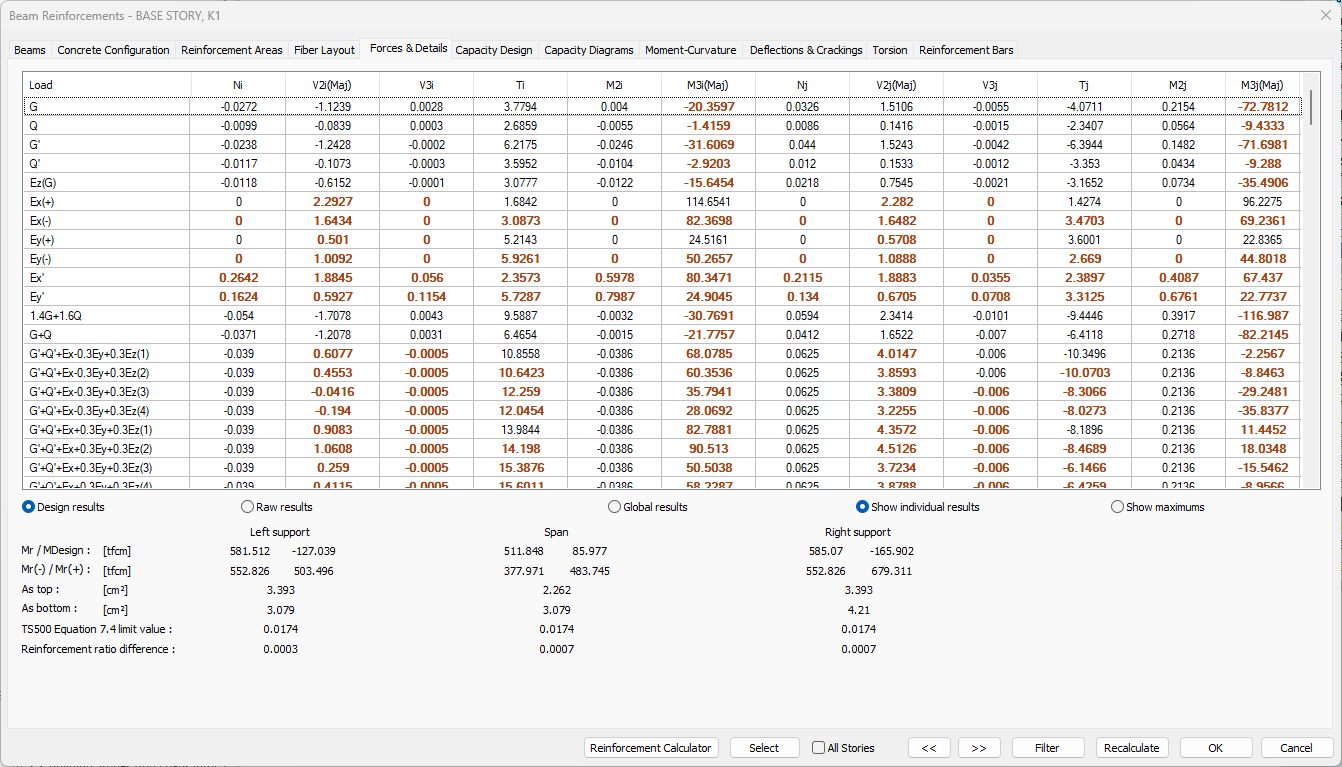
Forces and Details Tab
|
Specifications |
|---|
|
Table of forces 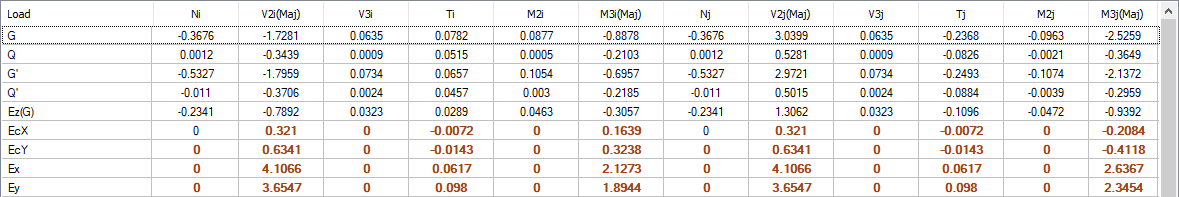
Load: The name of the respective load or load combinations.
|
|
Design results After the analysis, the regulation conditions have been applied, therefore it shows the end forces that have undergone changes and going to the design. In addition, the values used are shown in bold. End forces are values calculated on the element local axes. |
|
Raw results After analysis, it shows the raw end forces that are not applied to the regulation conditions. End forces are effects on the element local axes. |
|
Global results After the analysis, these are the values in global coordinates of the extreme forces that are not applied regulation conditions. |
|
Show individual results For 4 modal analysis cases, 4 different results are obtained from each earthquake loaded combination. If you want the program to display the values obtained for each modal state one by one, you should check this option. |
|
Show maximums The biggest values of 4 different results obtained from each load combination for 4 different modal cases are shown in the table. |
|
Moments and forces 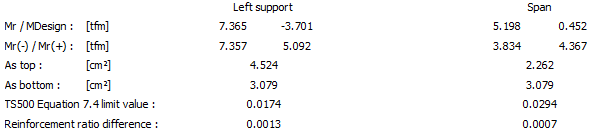
M values indicate the moments around the respective axis according to the global coordinate axis set, and the F values indicate the forces in the respective axis direction. Mr./Mdesign: Beam bearing strength and design moment values. Mr (-)/Mr (+): They are the moments of bearing strength calculated in the tensile and pressure regions of the section. As top: It is the total reinforcement areas in the upper parts of the section. As bottom: It is the total reinforcement areas in the lower parts of the section. Slip safety: If you saw this message, it means shear force controls on the beam are exceeded. The deflection is exceeding: If you saw this message, it means the beam is not providing deflection control. Maximum pursmail exceeded: If you see this message, it means that the beam does not provide maximum pursmail control. TS500 Balanced reinforcement ratio limit: It is 0.85 times the balanced rebar ratio defined in TS500 . Reinforcement ratio difference: It is the difference in tensile and compression rebar ratios at the element end. |
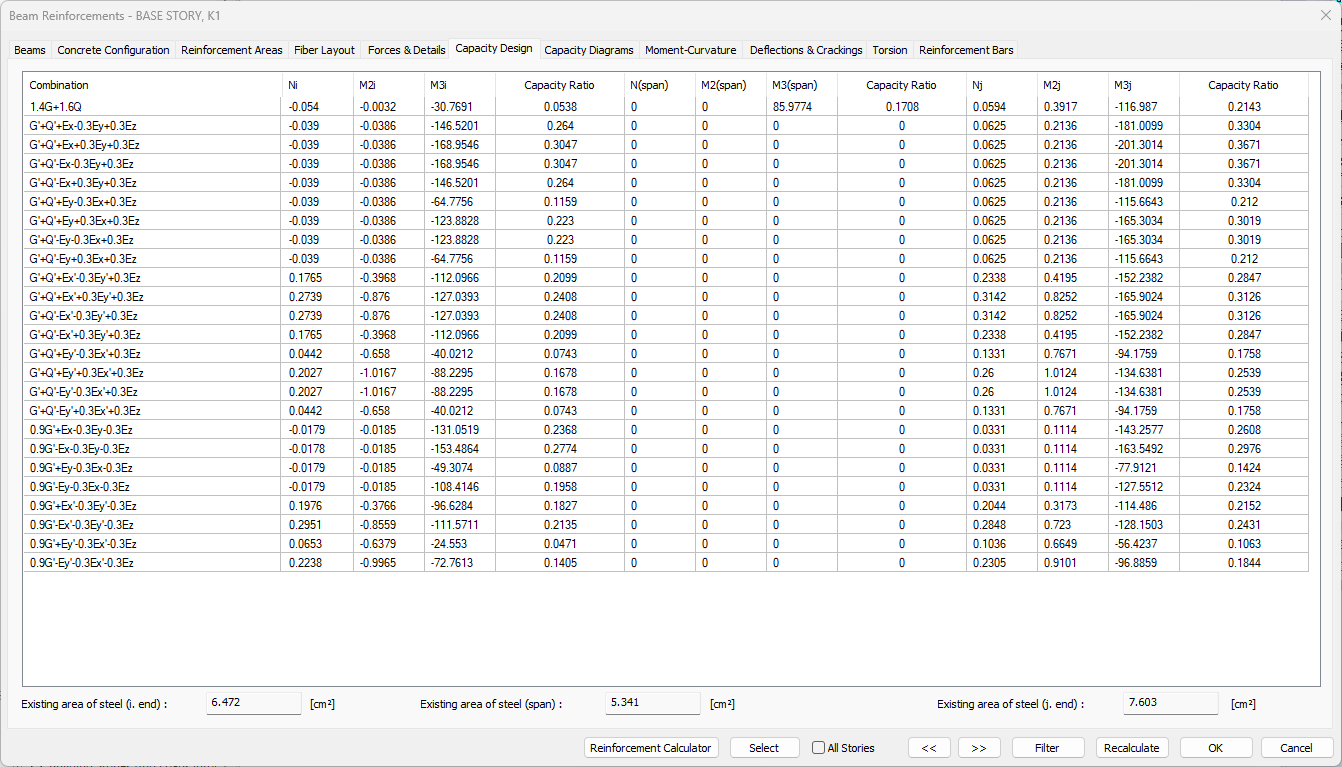
Capacity Design Tab
|
Specifications |
|---|
|
Capacity chart 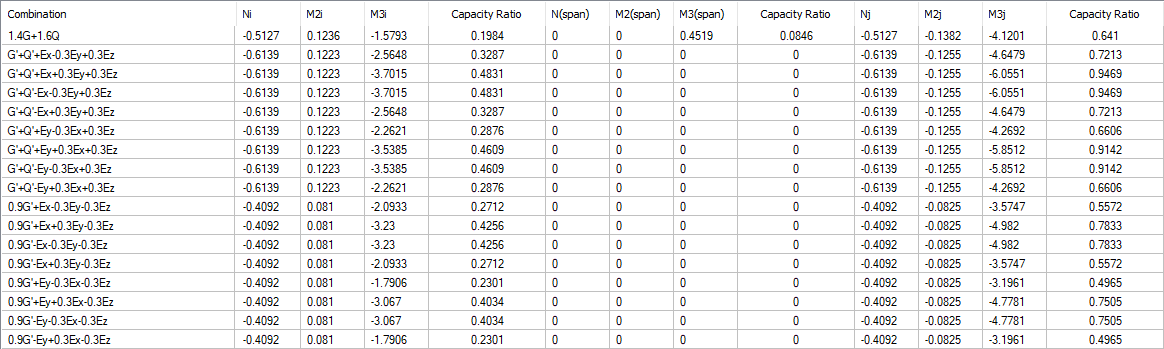
Combination: The corresponding combination is shown.
|
|
Existing area of steel The available reinforcement area values for end i, span and j end are shown. |
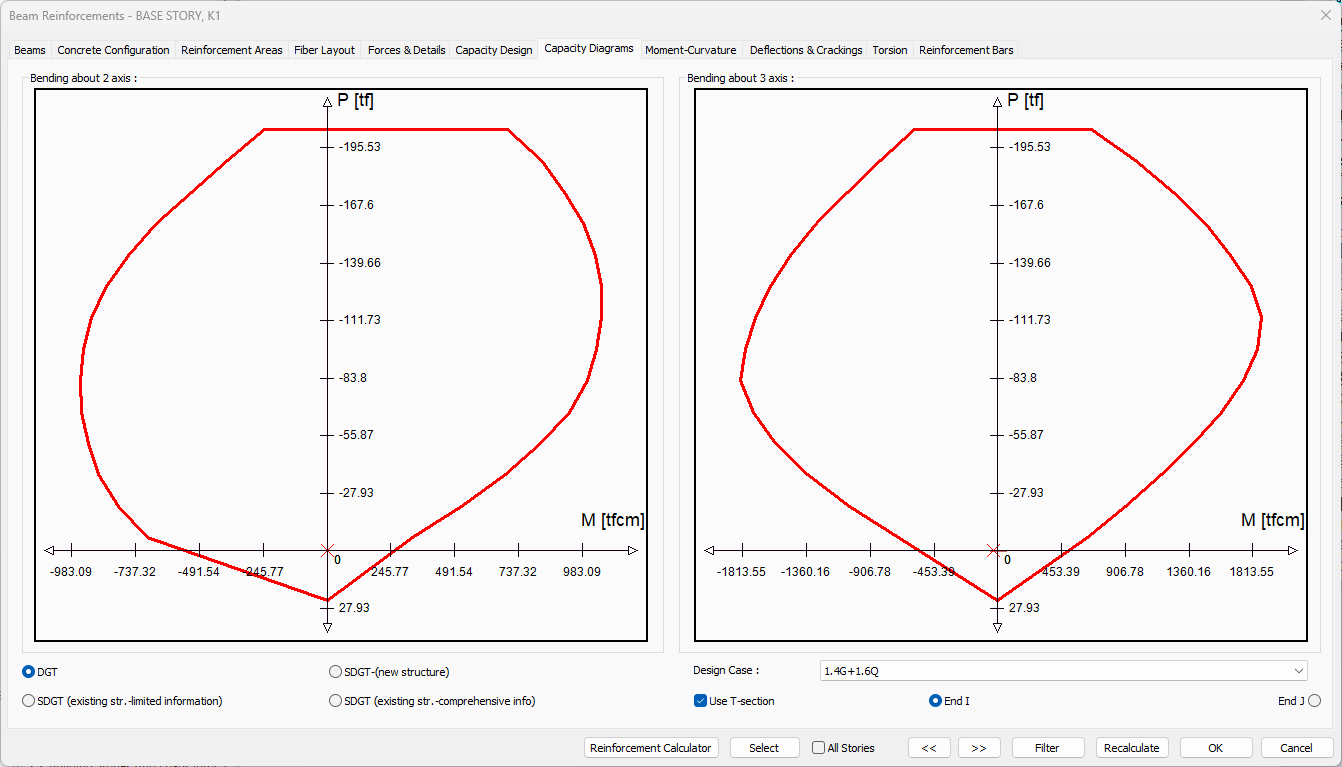
Capacity Diagrams Tab
|
Specifications |
|---|
|
Bending about 2 axis 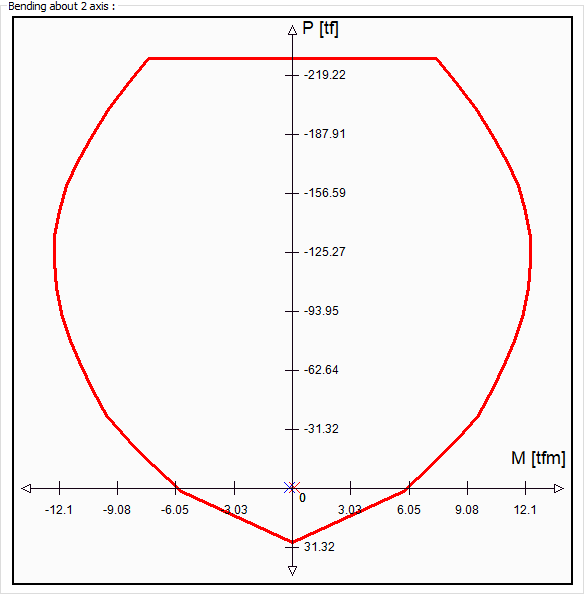
|
|
Bending about 3 axis 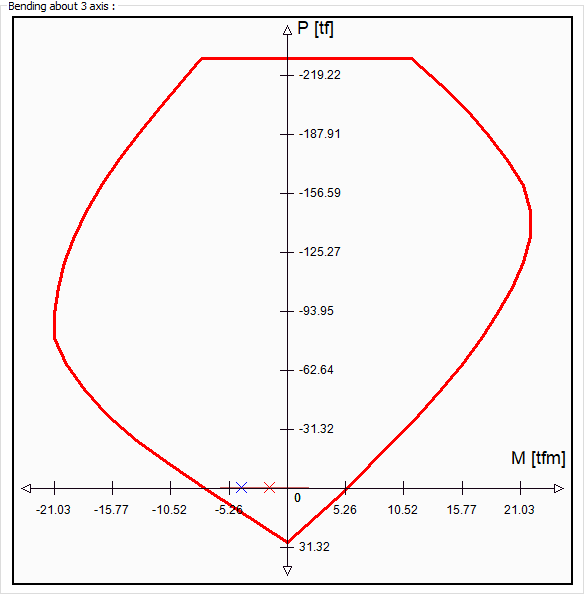
|
|
DGT Section cells and rebars are displayed according to the concrete and rebar material model criteria defined in TS500. |
|
SDGT - (new structure) The section cells and rebars are displayed according to the ŞGDT (new structure) criteria for the concrete and rebar material model defined in TBDY. |
|
SDGT - (existing str. - limited information) The section cells and rebars are displayed according to the ŞGDT (existing structure - limited information) criteria for the concrete and rebar material model defined in TBDY. |
|
SDGT - (existing str. - comprehensive info) The section cells and rebars are displayed according to the ŞGDT (existing structure - comprehensive information) criteria for the concrete and rebar material model defined in TBDY. |
|
Design case The combination for the capacity diagrams to be examined can be selected from the list. |
|
Use T-section If the option is selected, t-section is used. |
|
End I Shows the arrangement of fibers and reabers at the i-end of the beam. |
|
End J Shows the fiber and rebar arrangement at the j end of the beam. |
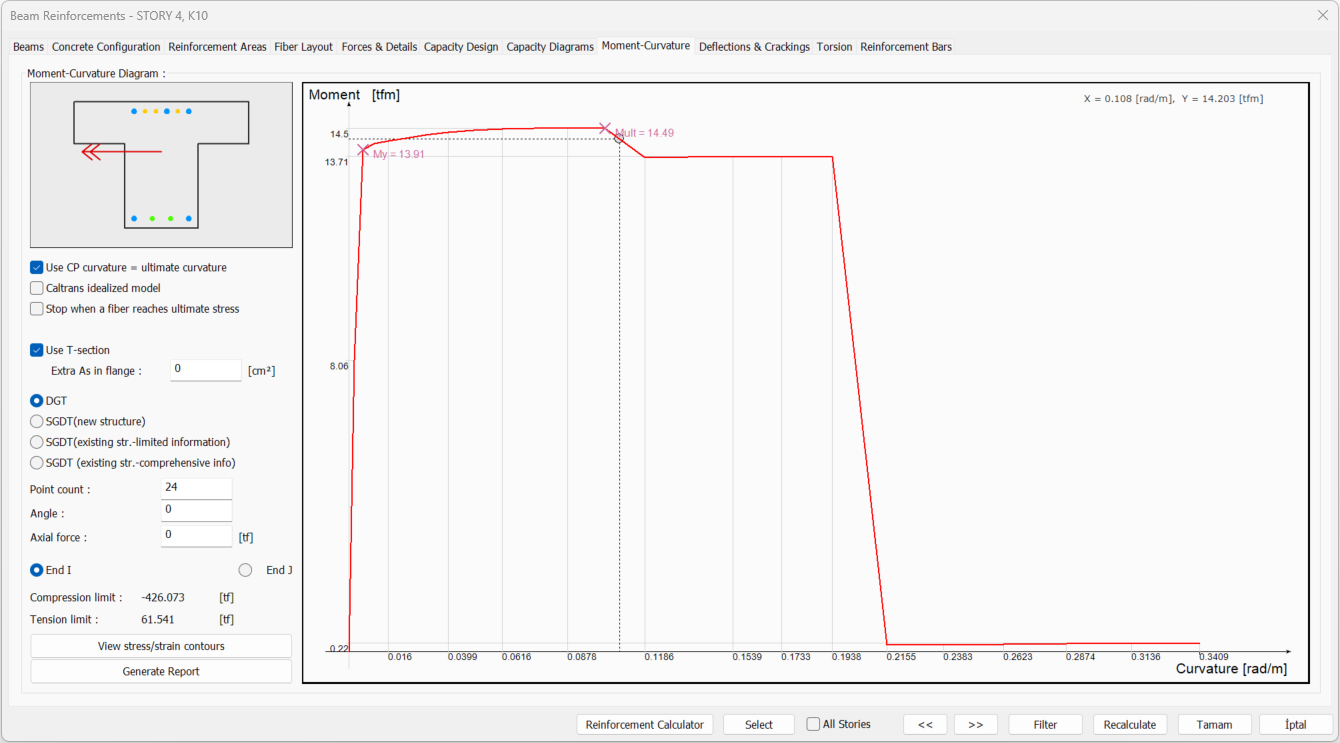
Moment - Curvature Tab
|
Specifications |
|---|
|
Schematic drawing 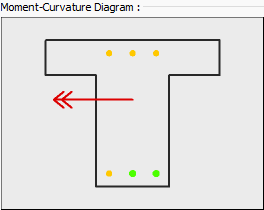
|
|
Moment - curvature diagram 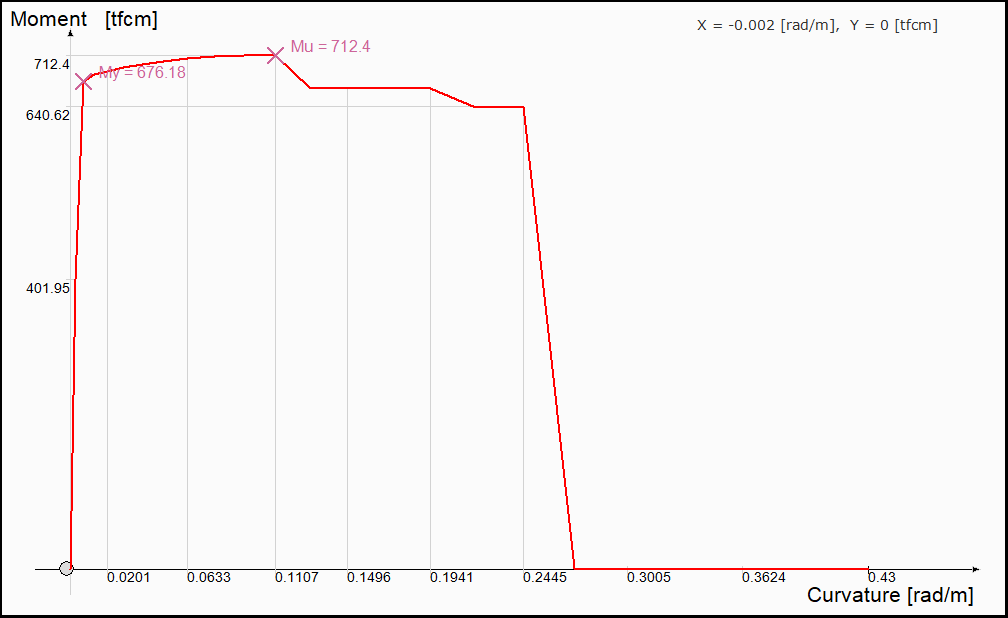
|
|
Use CP curvature = ultimate curvature When this option is selected, the ultimate strain of the concrete and reinforcement material is used to calculate the plastic rotation limit values for performance levels. |
|
Caltrans idealized model If marked, the Moment-Curvature plot is idealized. It is a moment curvature relationship obtained by drawing a horizontal line that intersects with an inclined line passing over the moment of yield and will equalize the areas between the moment curvature graph. |
|
Stop when a fiber reaches ultimate stress If checked, the graphic ends when the graphic fiber reaches its highest stress. |
|
Use T-section If the option is selected, t-section is used. |
|
Extra as in flange It is the extra reinforcement area to be taken into account in the t-section due to the slab reinforcement. The reinforcement area value written here is added to the existing beam reinforcement area. |
|
DGT Section cells and rebars are displayed according to the concrete and rebar material model criteria defined in TS500. |
|
SGDT 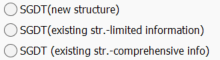
The section cells and rebars are displayed according to the SGDT criteria for the concrete and rebar material model defined in TBDY. |
|
Point count It is used to determine how many points the moment curvature graph consists of. |
|
Angle It shows the neutral axis angle from which the moment curvature relationship is obtained. It is indicated with a red arrow in the image above. |
|
Axial force It shows under which axial force the moment curvature relationship is drawn. |
|
End I Shows the arrangement of fibers and reabers at the i-end of the beam. |
|
End J Shows the fiber and rebar arrangement at the j end of the beam. |
|
Compression limit The determined material model is the largest axial pressure force that the section can take in the moment-normal force interaction. |
|
Tension limit The determined material model is the largest axial tensile force that the section can take in the moment-normal force interaction. |
|
View stress/strain contours It shows the stress and strain state in section in color format at each step of the moment curvature relationship. |
|
Generate report Creates a detailed report of moment-curvature. |
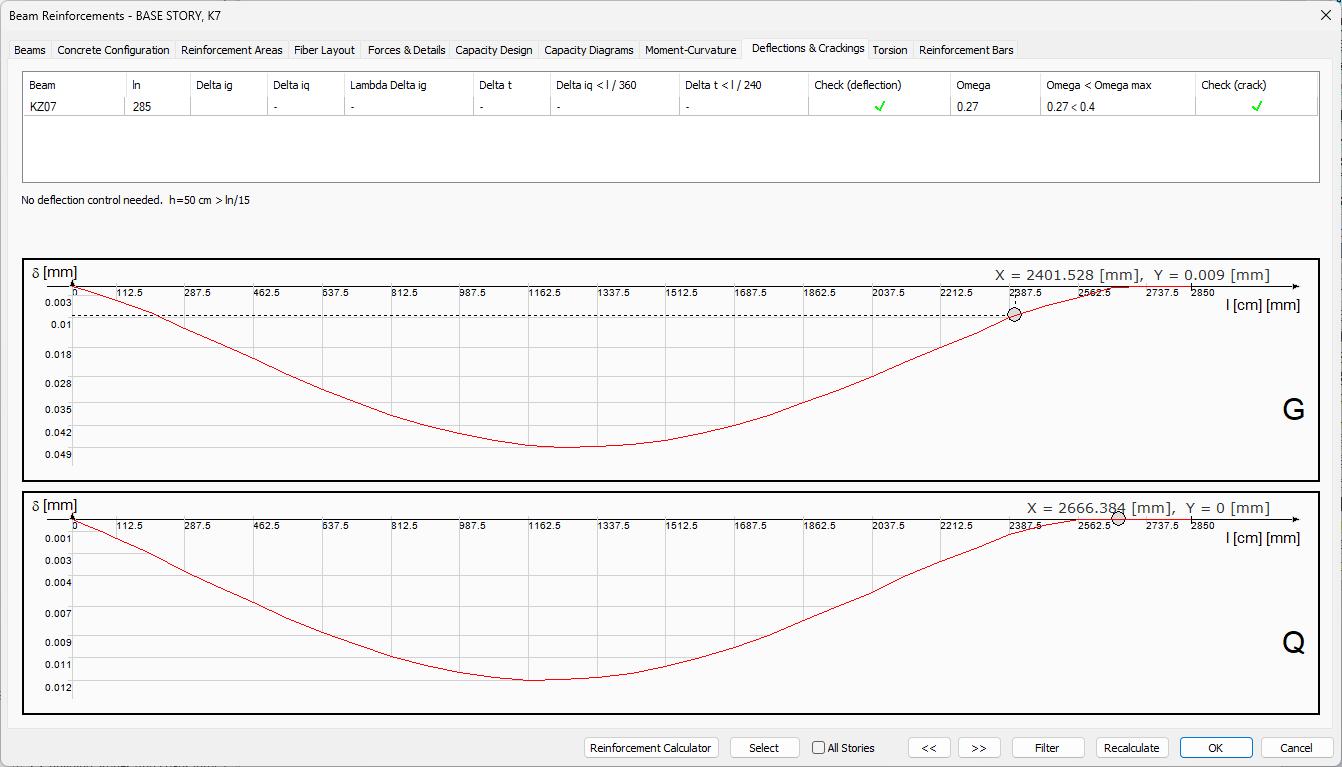
Deflections and Crackings Tab
|
Specifications |
|---|
|
Deflection and crack table 
The values usesd in deflection and crack controls, deflection and crack results are given. Beam: It is the name of the beam where deflection and crack control results are shown.
|
|
Deflection curve due to dead load 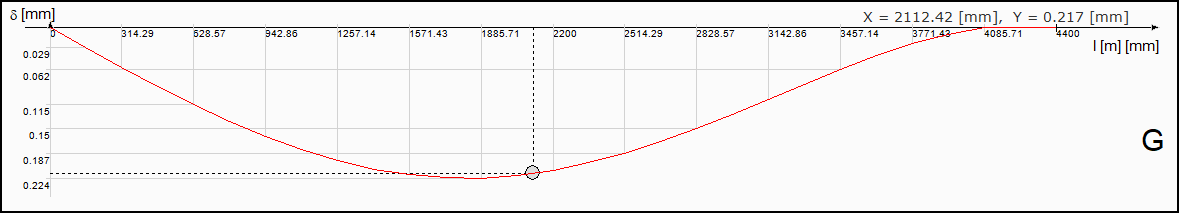
|
|
Deflection curve due to live load 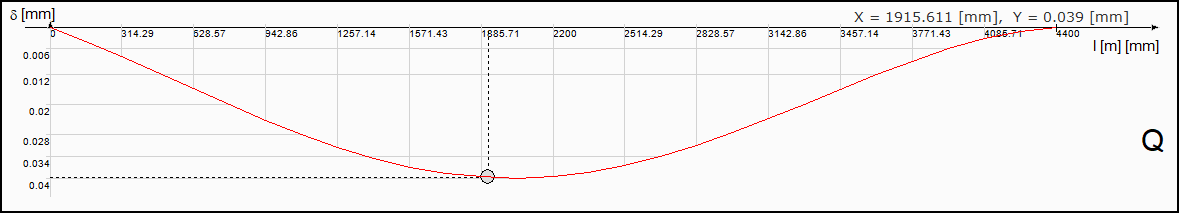
|
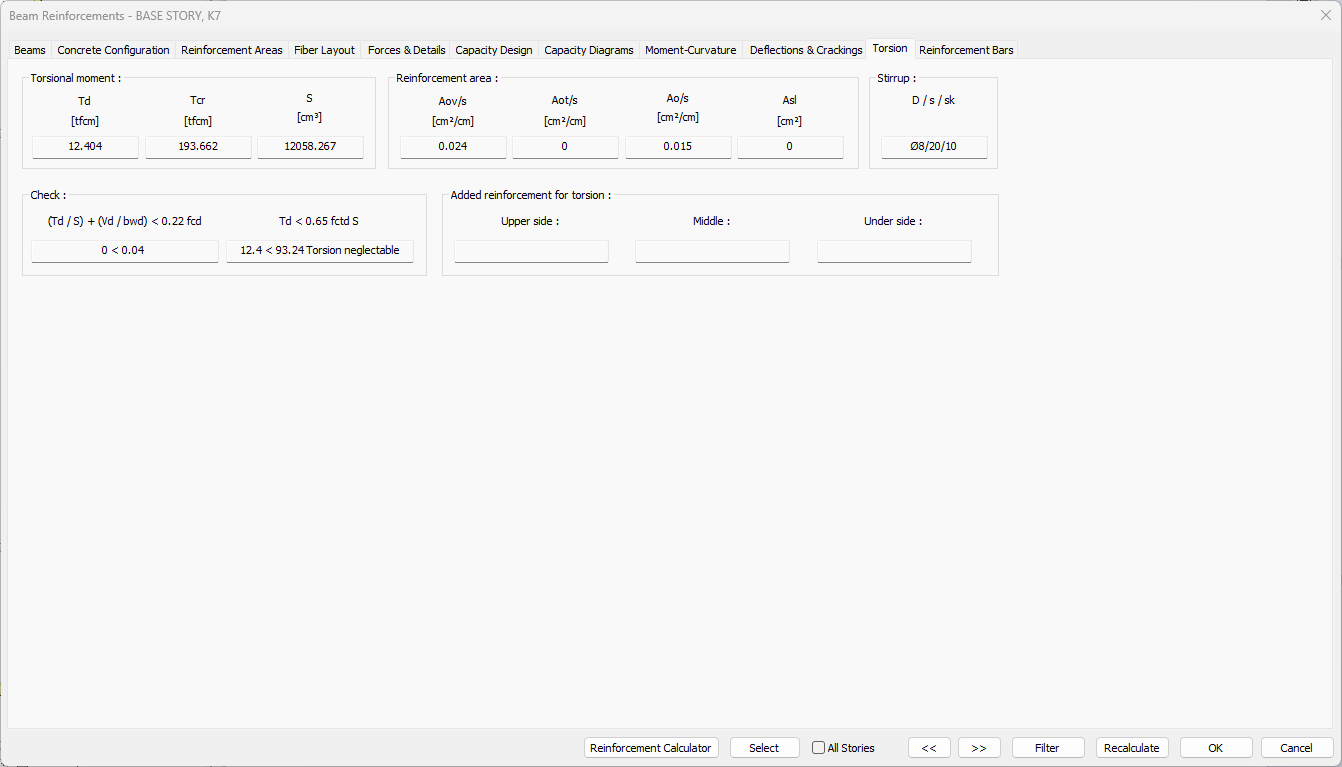
Torsion Tab
Torsion controls on beams are made according to the method recommended in TS500. In this tab, the values used in beam torsion controls, if there are any rabers that need to be placed in the section as a result of torsion calculations, their information is shown. .
|
Specifications |
|---|
|
Torsional moment 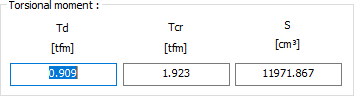
Td: The design torque value.
|
|
Reinforcement area 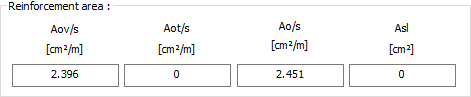
Aov / s: It is the value of the stirrup cross section required for cutting at 1 meter section.
|
|
Stirrup 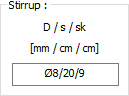
D: It is the rebar diameter value.
|
|
Check 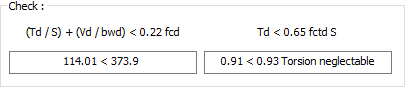
|
|
Added reinforcement for torsion 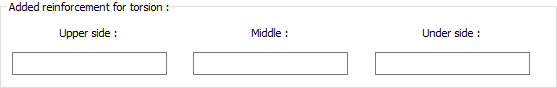
Information on the torsion reinforcement in the upper, middle and under parts of the beam is given. |
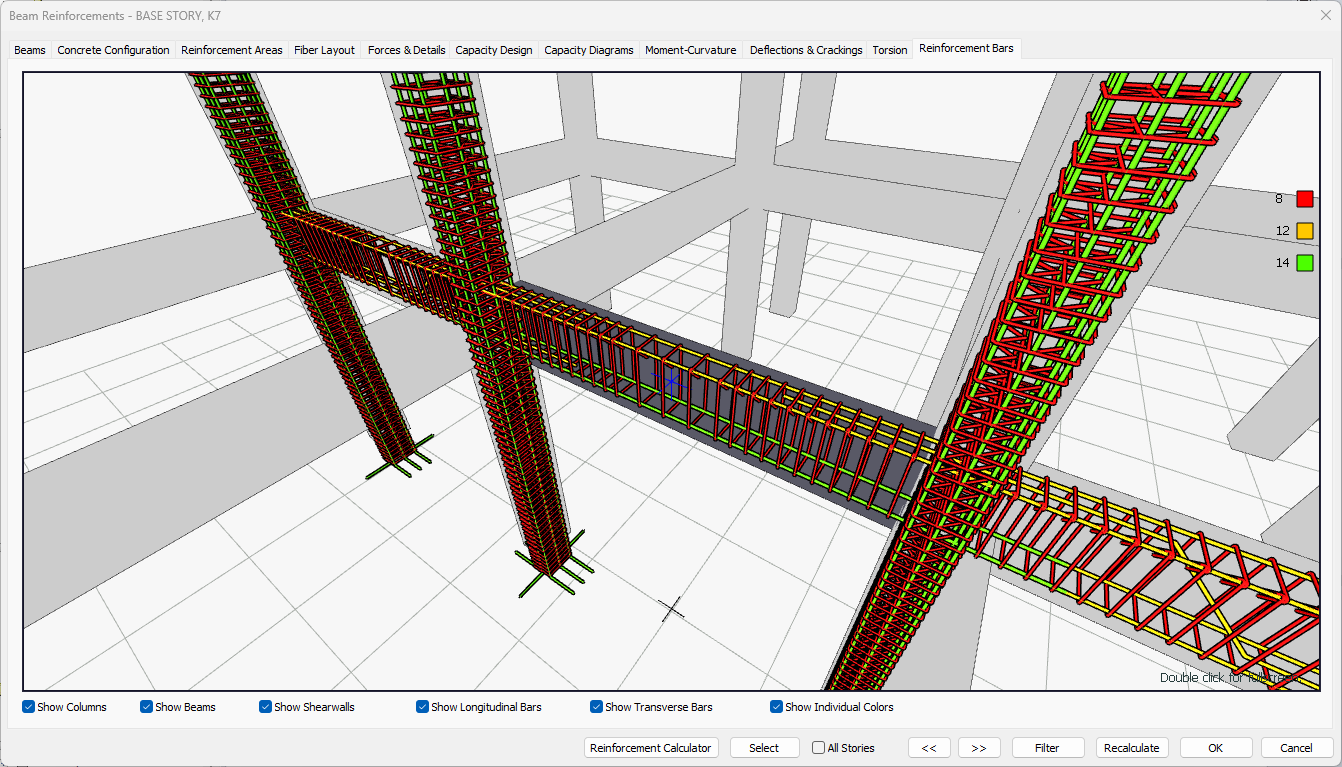
Reinforcements Bar Tab
In this tab, the three-dimensional rebar image of the beam is shown.
|
Specifications |
|---|
|
3D image 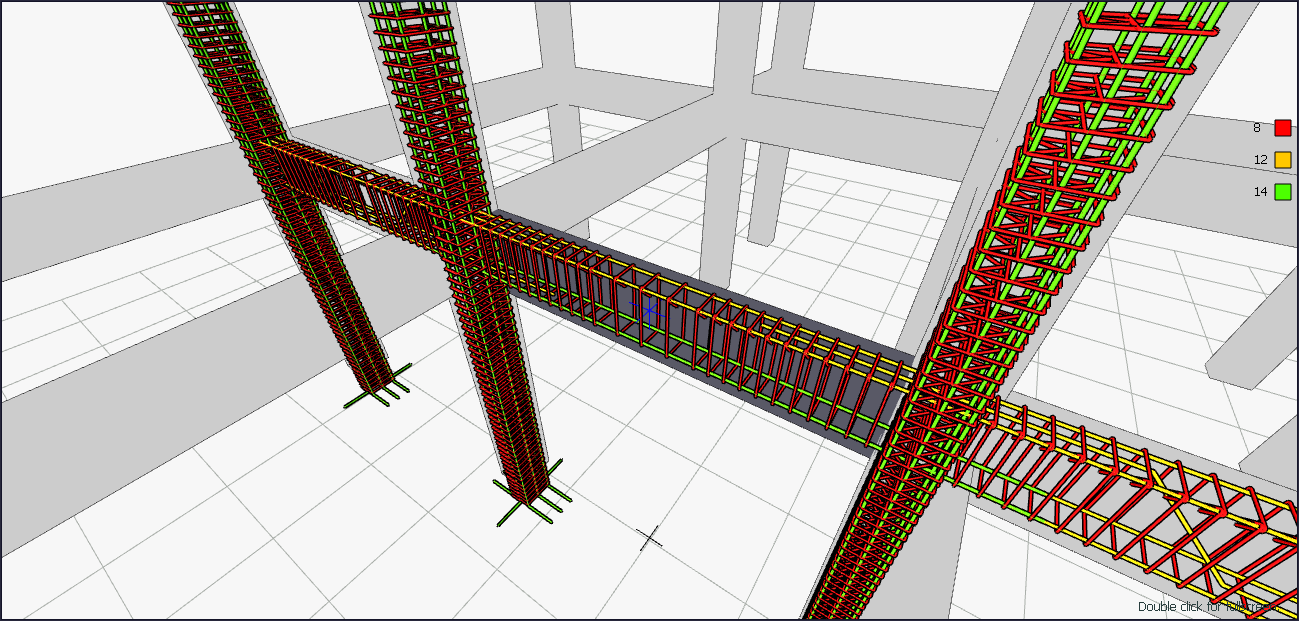
|
|
Show columns If the option is selected, column rebars are shown on the screen. |
|
Show beams If the option is selected, beam rebars are shown on the screen. |
|
Show shearwalls If the option is selected, shearwall rebar is shown on the screen. |
|
Show longitudinal bars Longitudinal bars of the elements with option marked are shown on the screen. |
|
Show transverse bars The transverse reinforcements of the elements with options are displayed on the screen. |
|
Show individual colors If the option is selected, bars with different diameters are shown in different colors. Which color represents which diameter is on the right of the screen. If the option is off, all of the rebars are shown in red. |
Next Topic
Related Topics