
The thrust analysis results of the 3-storey building whose plan plane is as follows were examined.
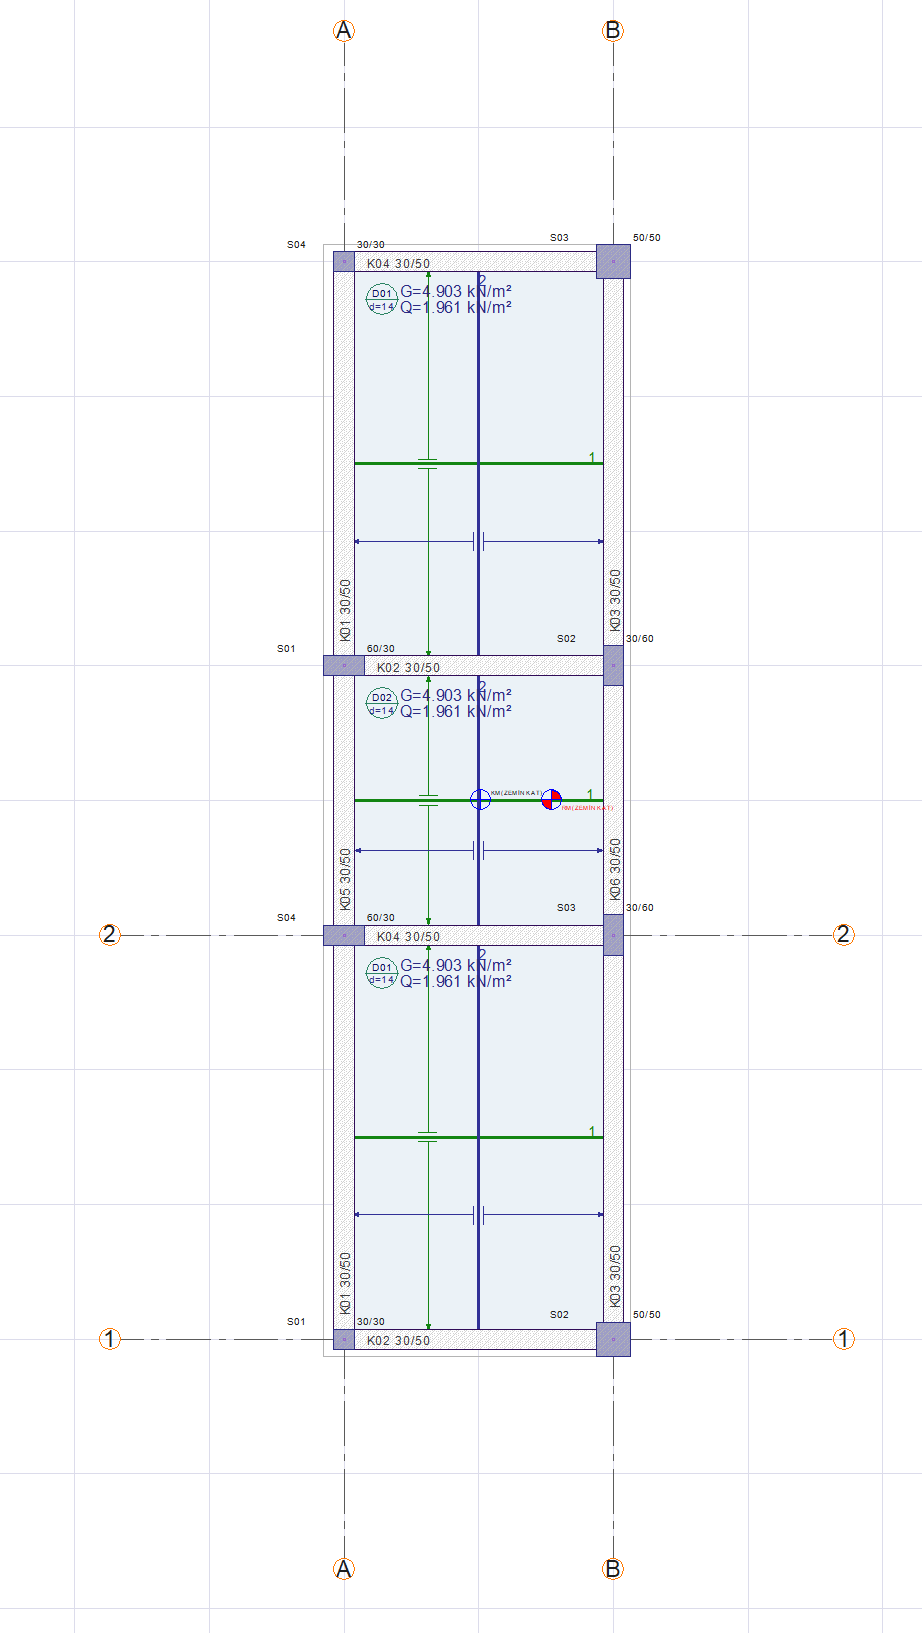
Materials C25-S420 Storey heights 3.5m - 3.0m - 3.0m
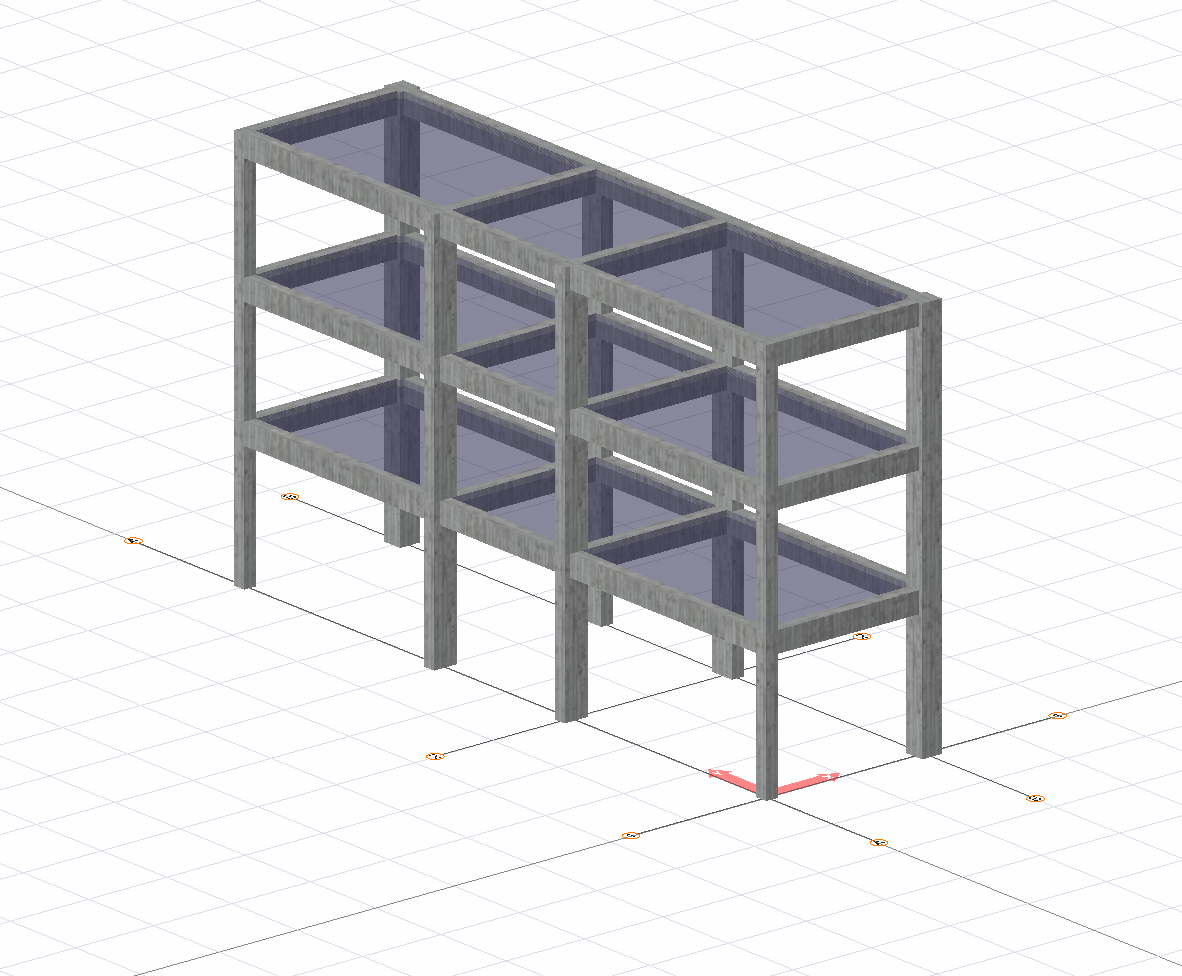
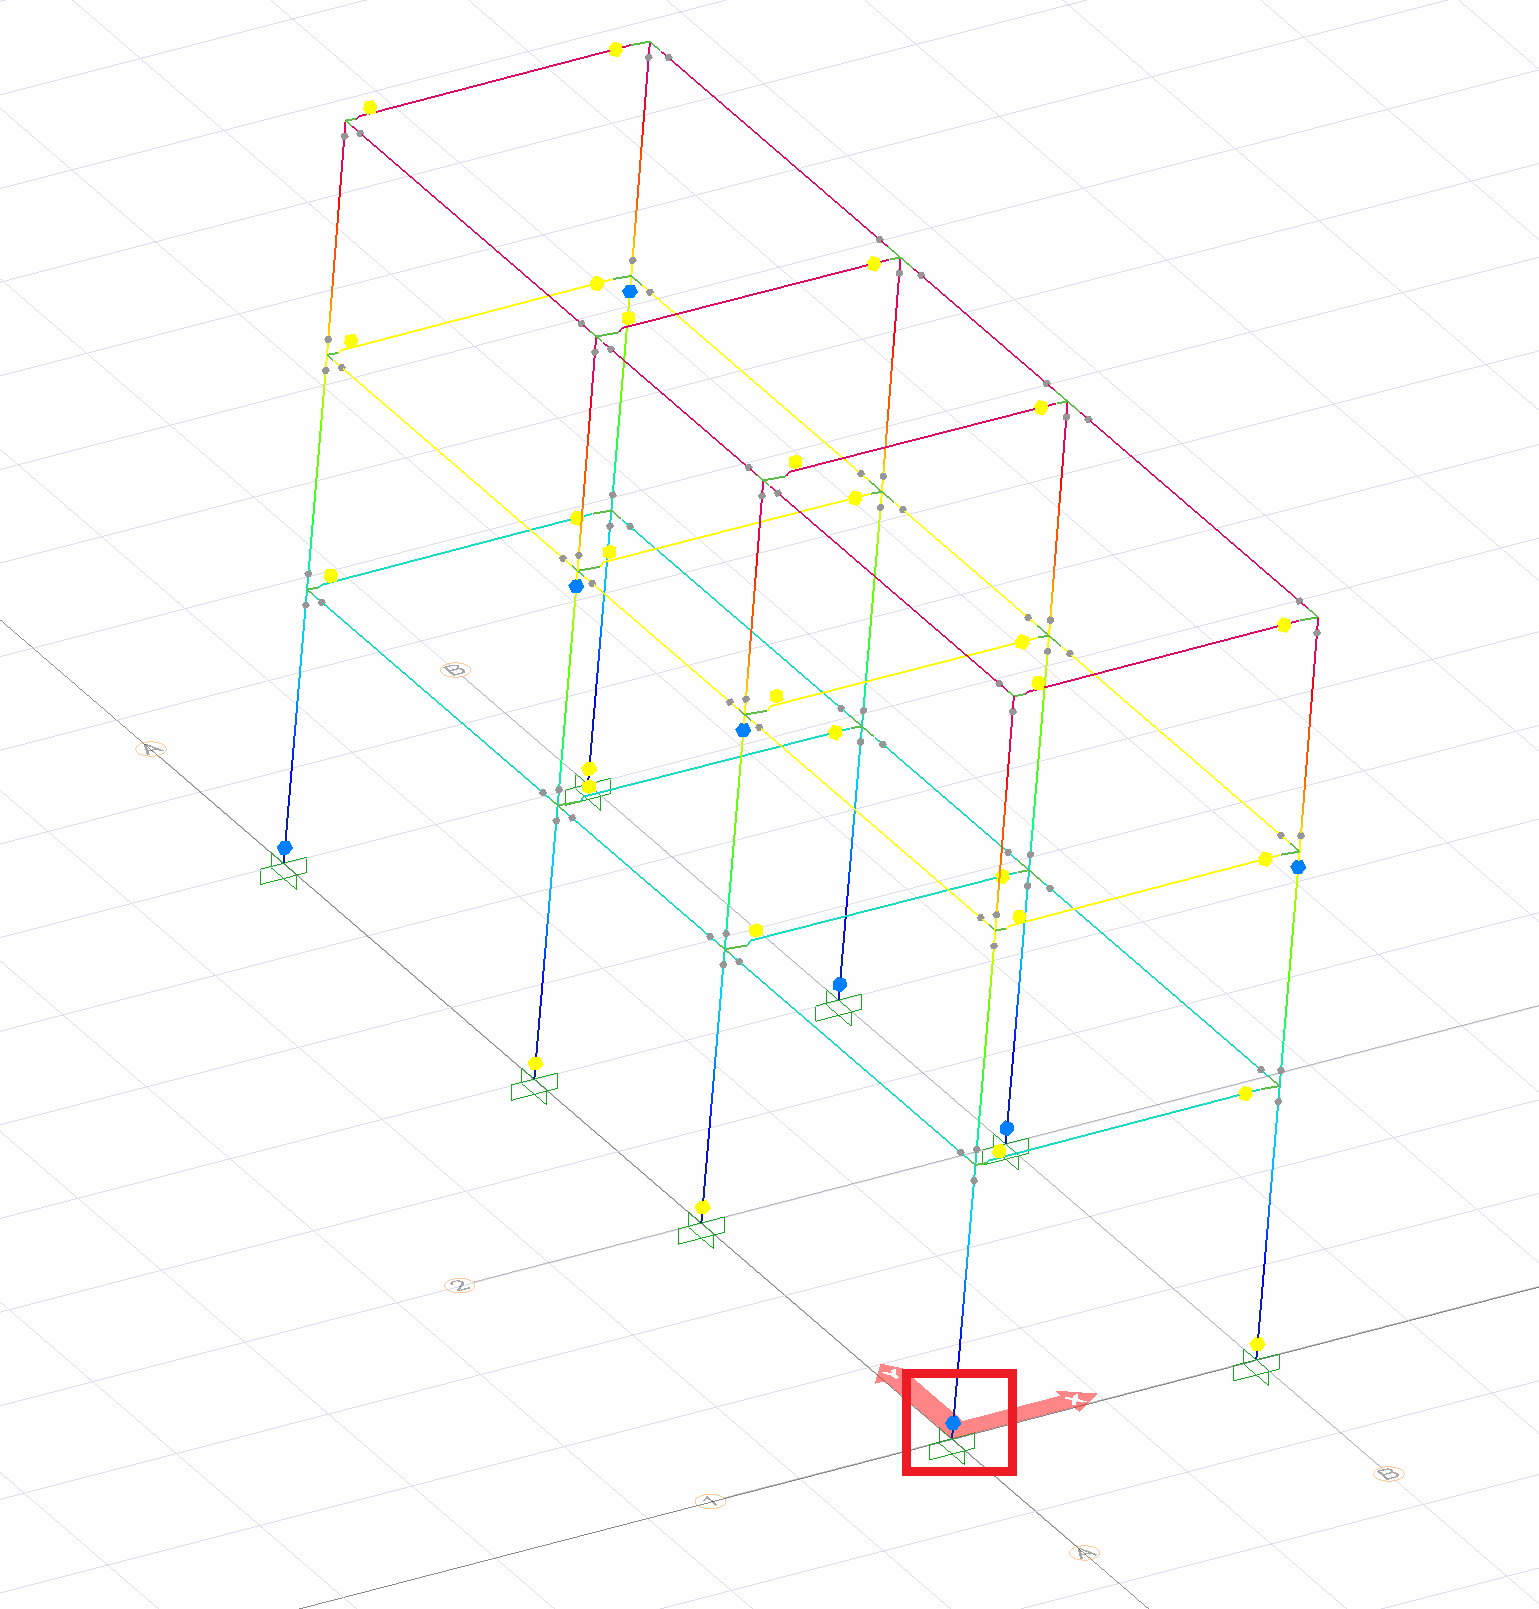
3D view of the building is given below.
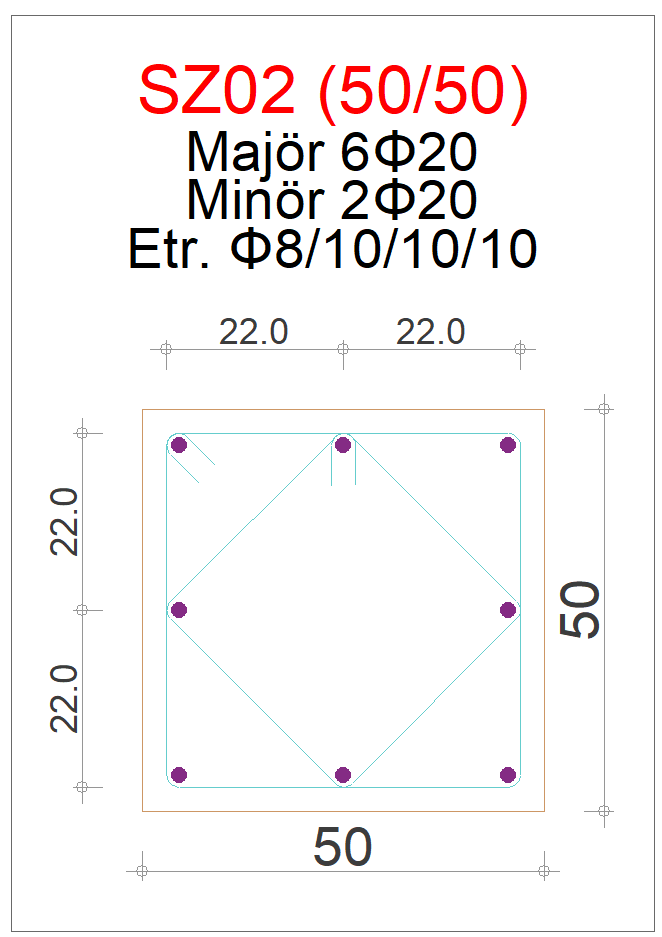
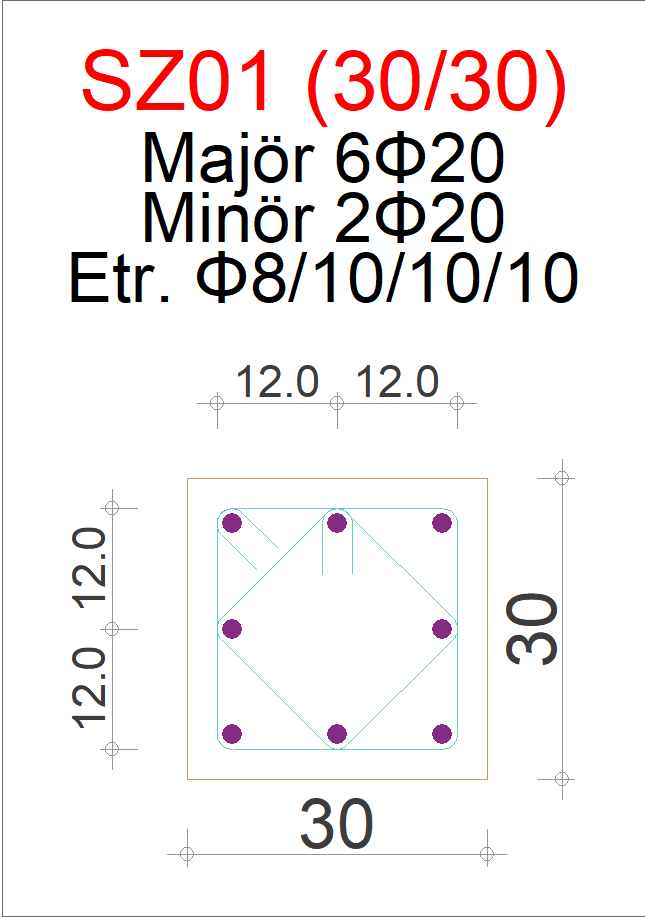
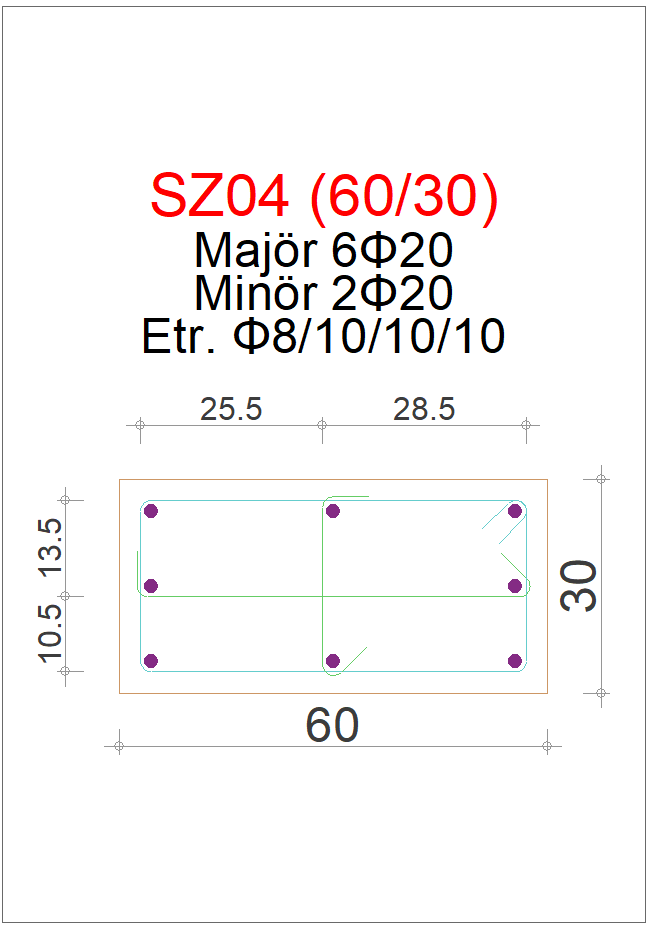
Column reinforcements are given below.
The ideCAD v10.20 version of the building is given below.
3 kat-Yeni Model-10_20_saf.rar
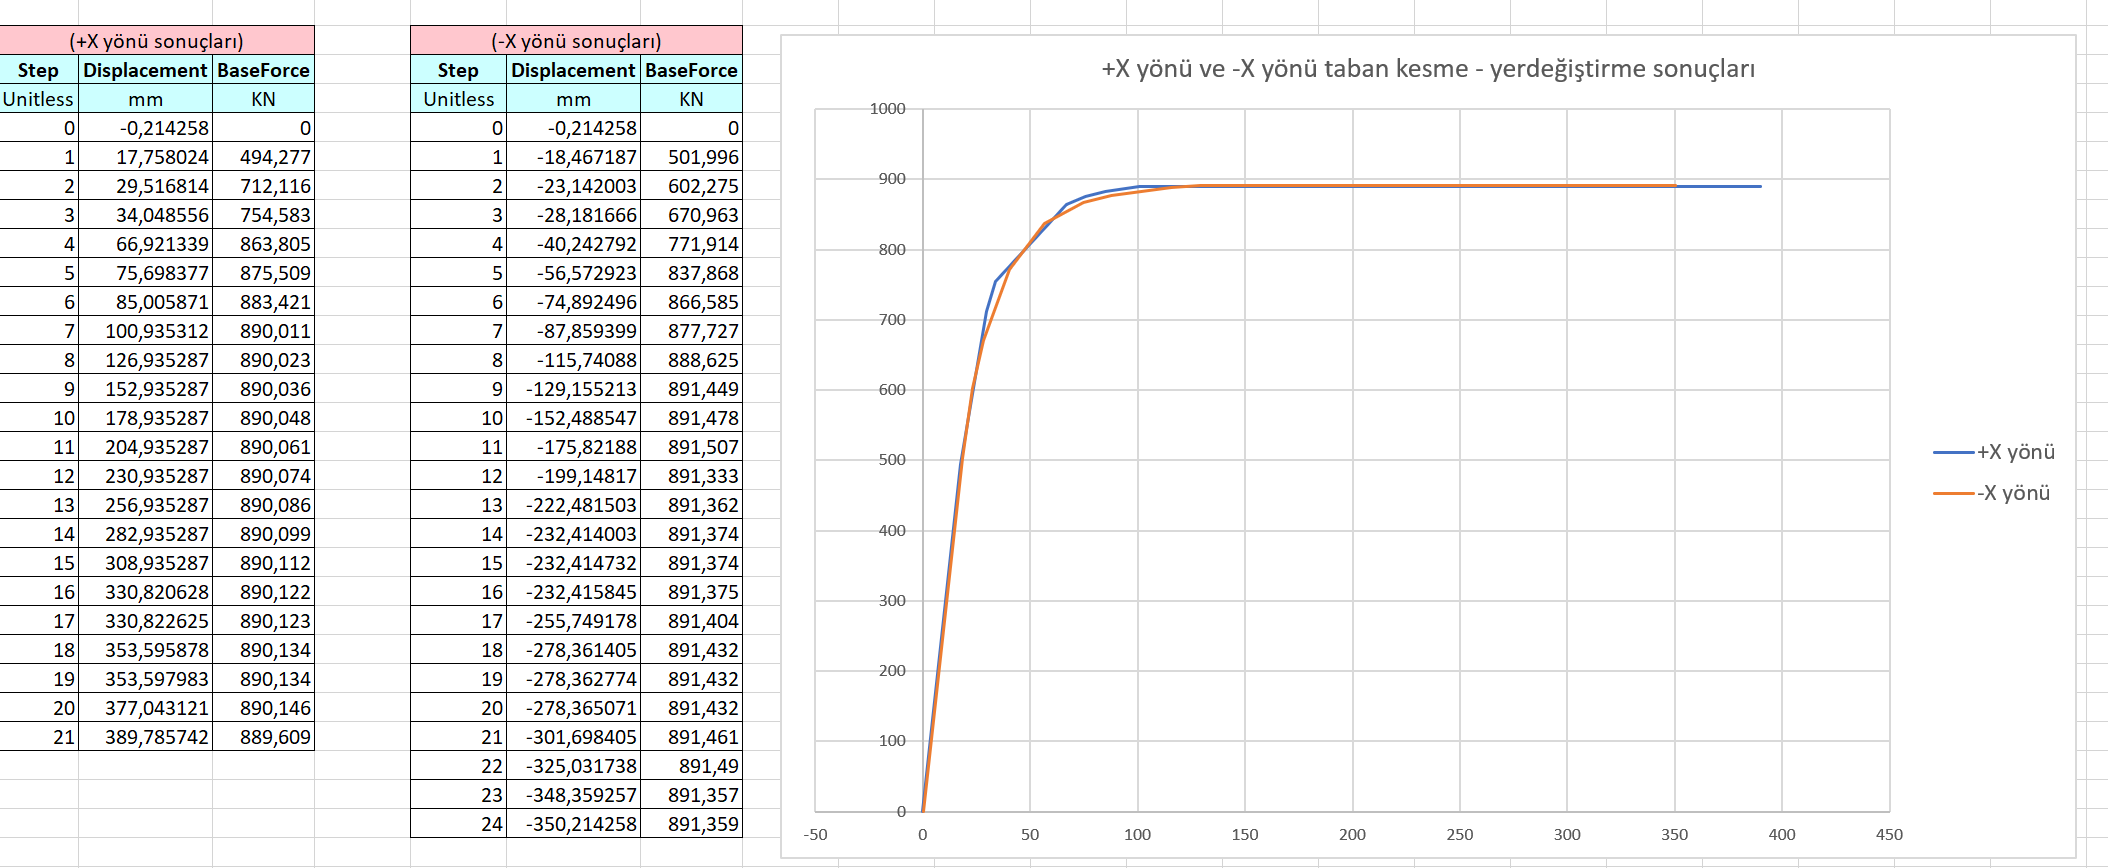
When modal analysis is done in Sap2000, T = 0.518. In this case, when the single mode repulsion analysis is performed, the base shear force-ceiling displacement values for the + X and -X direction are given below.
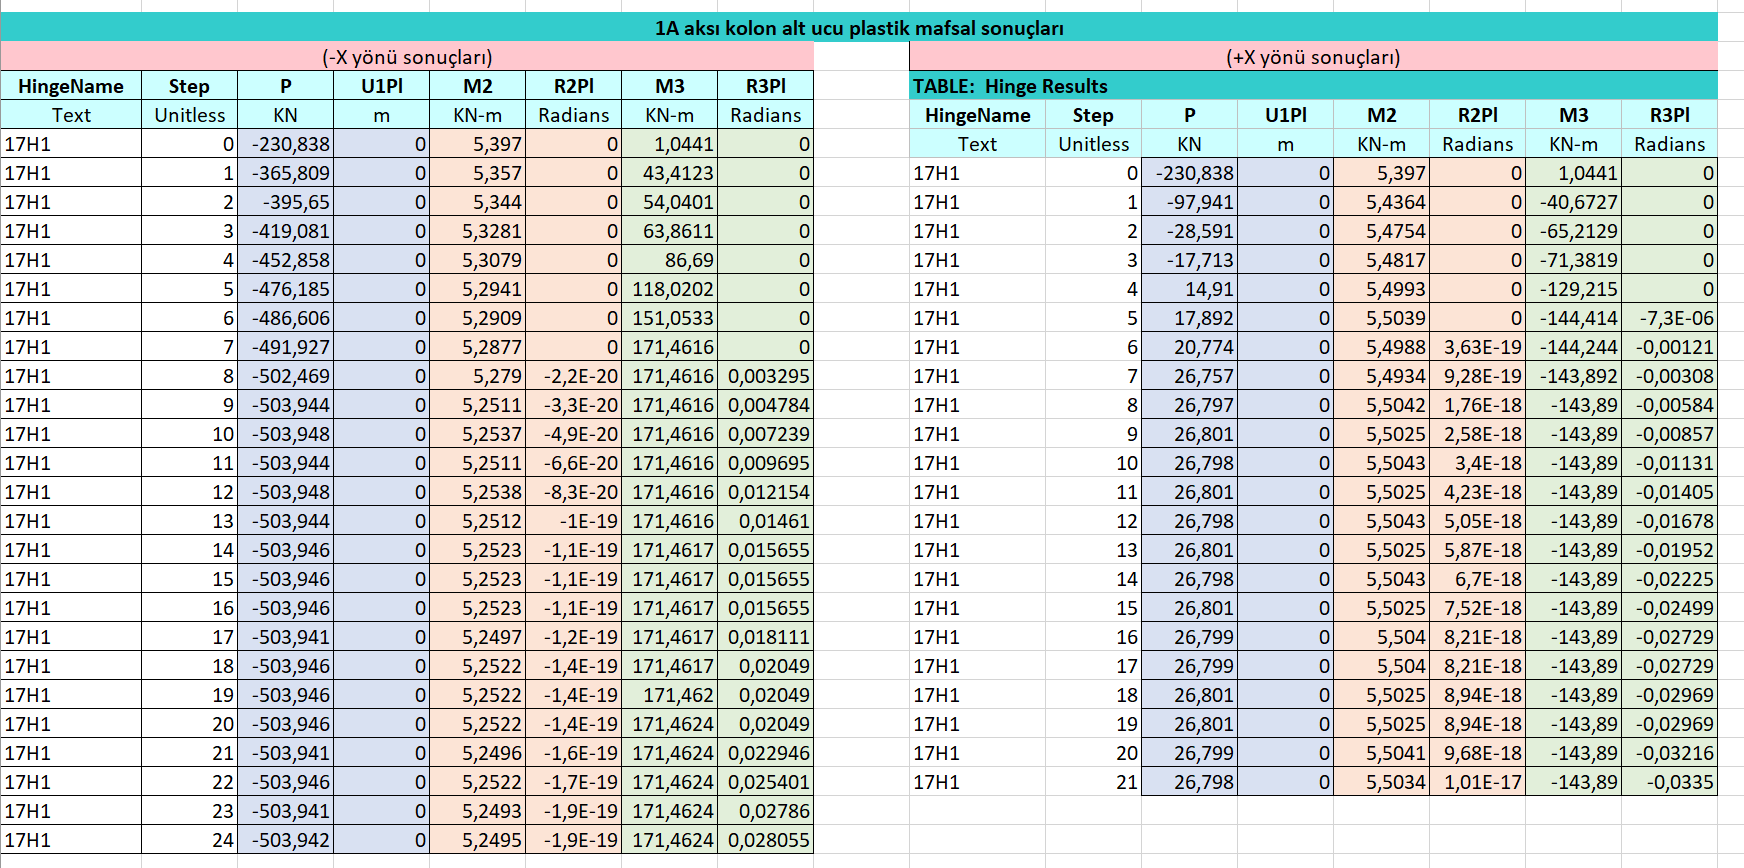
The plastic joint results at the lower end of the column at the intersection of 1-A axes are given below.
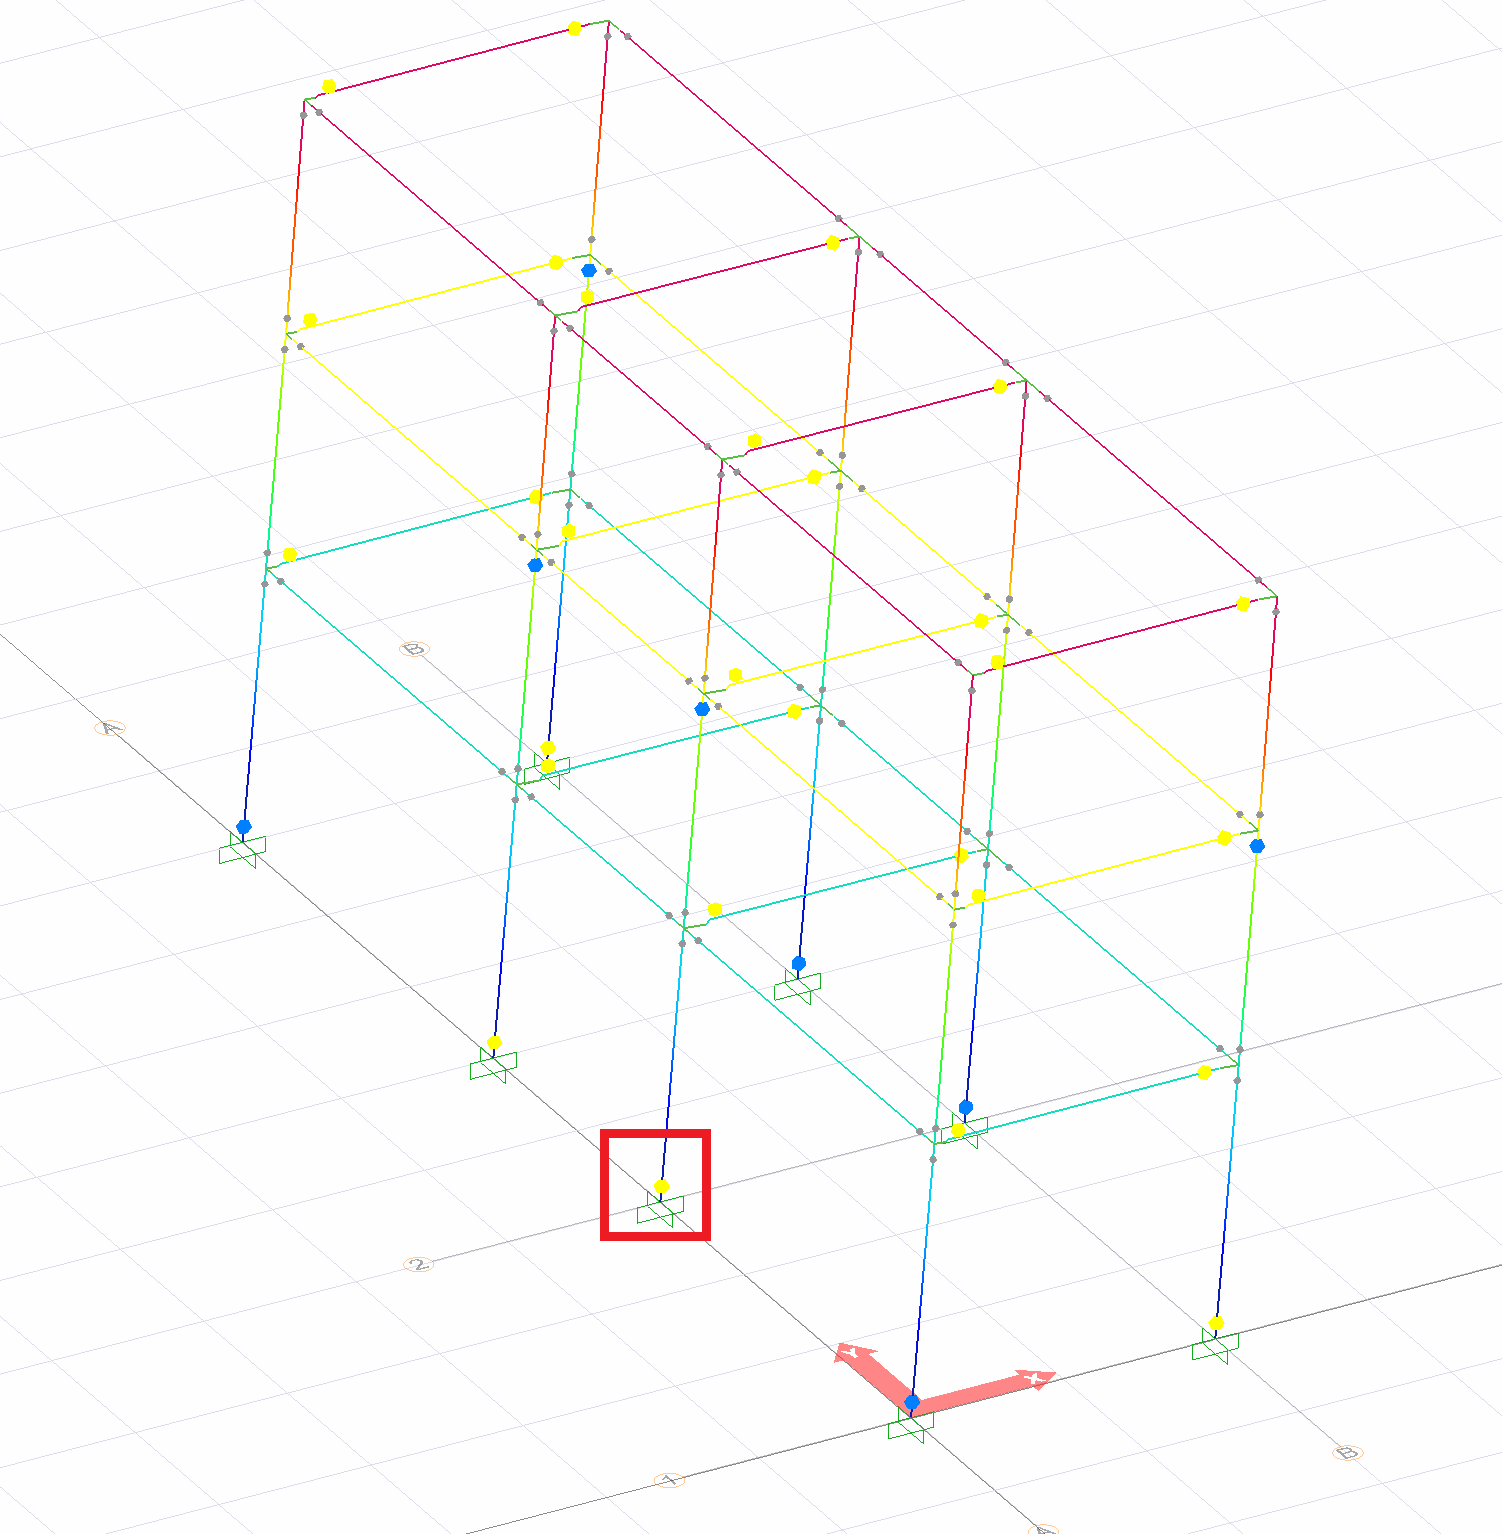
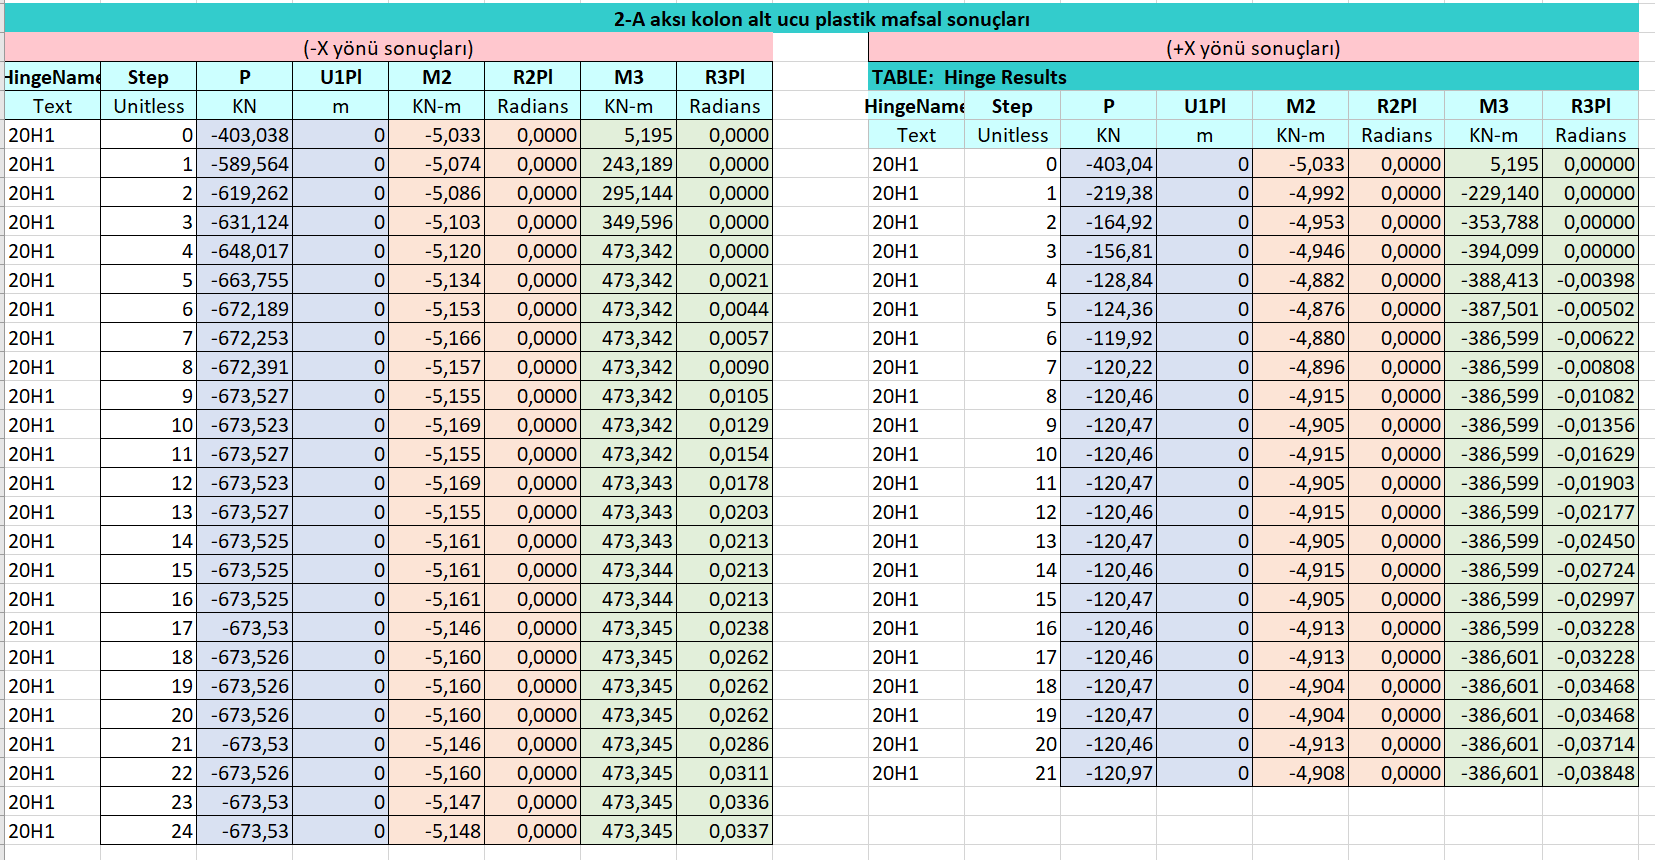
The plastic joint results at the lower end of the column at the intersection of 2-A axes are given below.
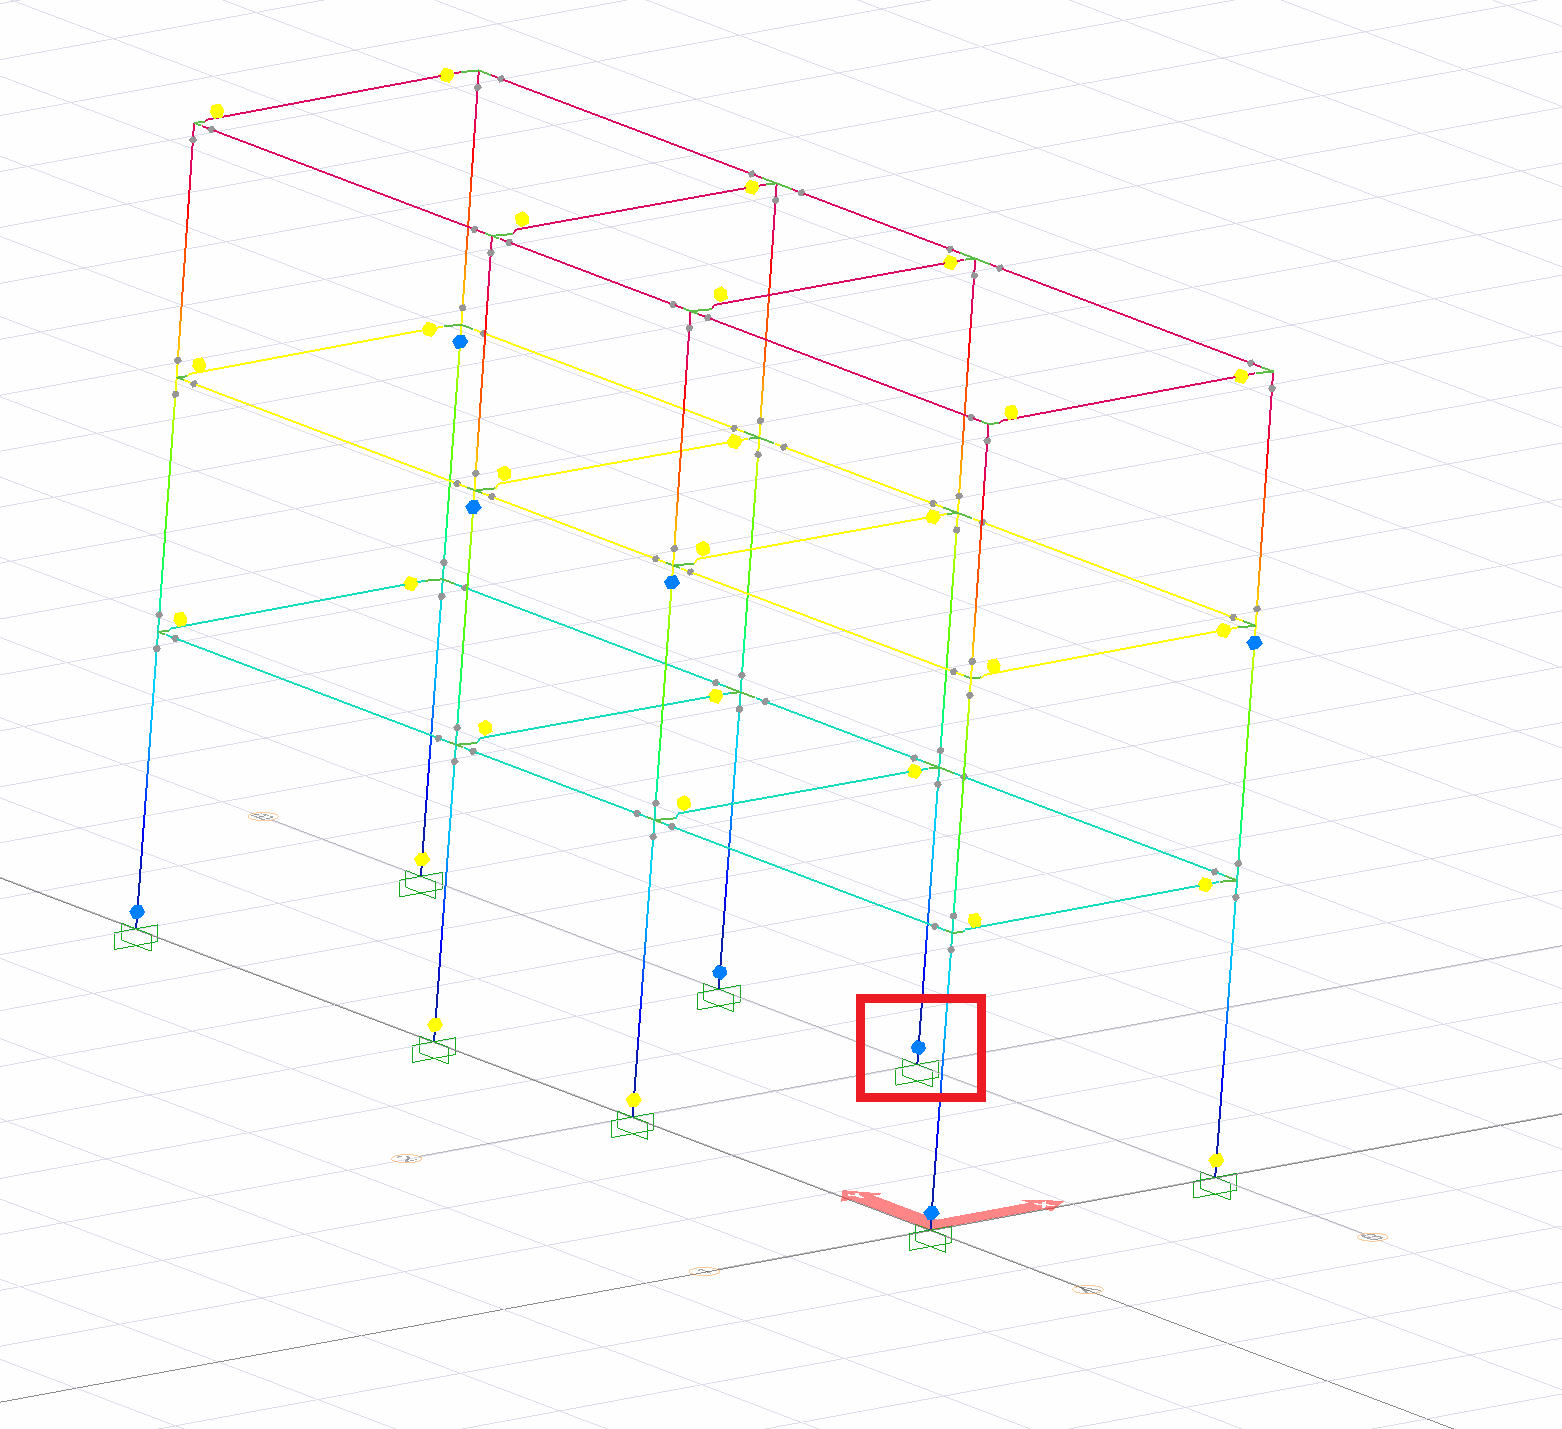
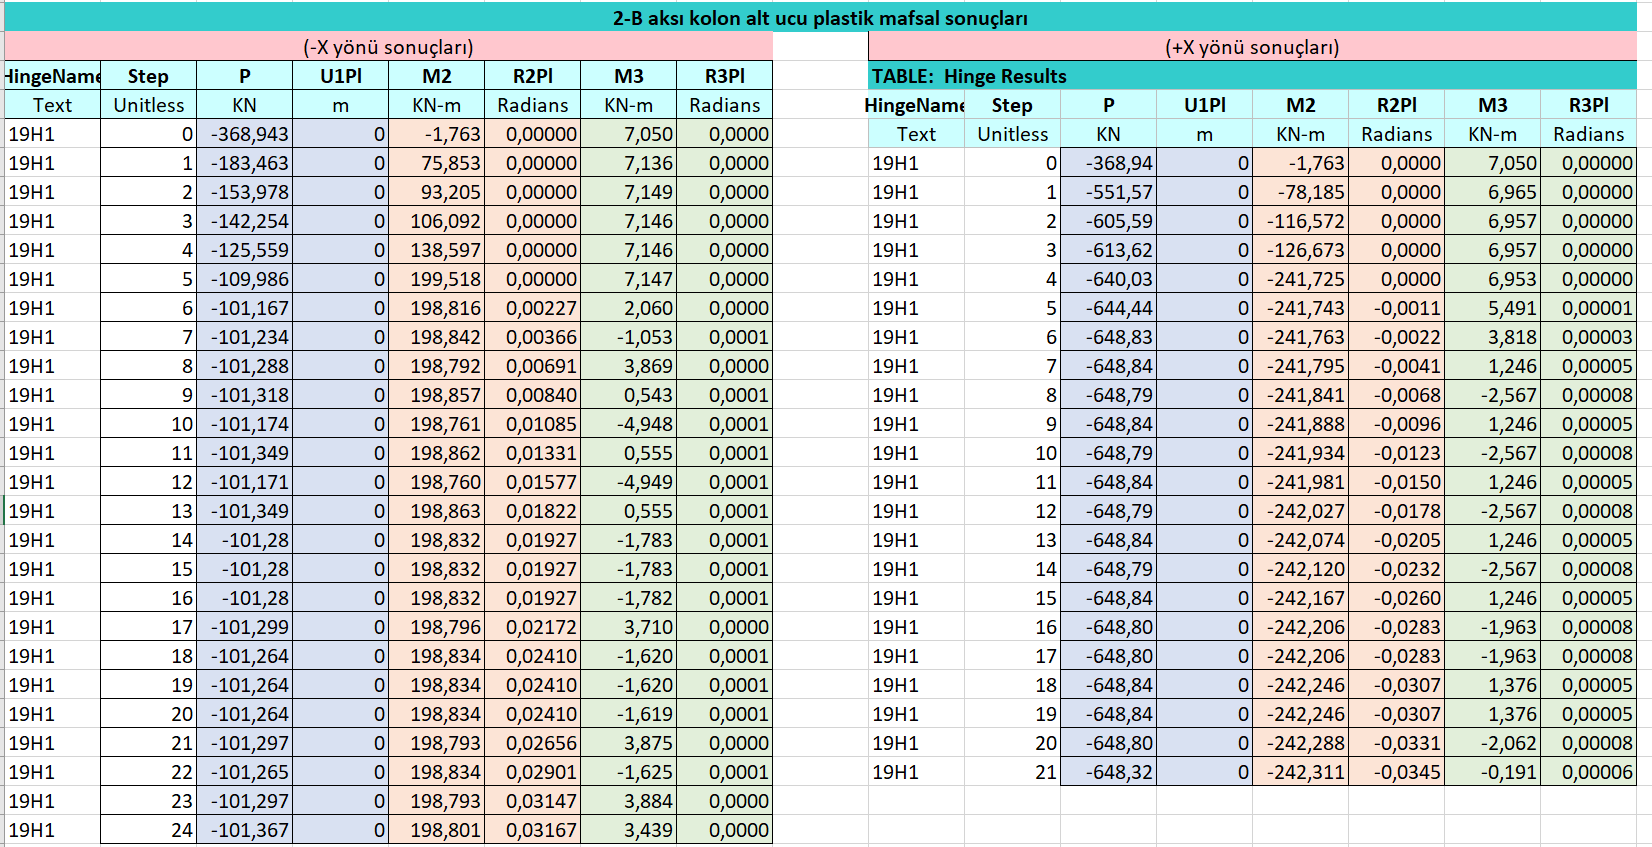
The plastic hinge results at the lower end of the column at the intersection of 2-D axes are given below.
Next Topic
Related Topics