
-
As a result of the thrust analysis, the plastic deformation values of the element are found automatically.
-
The curvature analysis of the cross section is automatically made by taking into account the concrete and reinforcement models given in Annex 5A to be used in the performance evaluation to be made for the performance level of migration prevention (PI) .
-
As a result of the curvature analysis, the plastic rotation limit value to be used in the performance evaluation for the performance level of Prevention of Migration (DF) is calculated automatically according to Equation 5.6 .
ICONS
d b = Diameter of longitudinal reinforcement (average at tensile) [m]
L p = Plastic hinge length [m]
L s = Shear opening [m]
f co = Uncovered concrete compressive strength
f sy = Yield strength of reinforcement steel
f ck = Characteristic pressure of concrete strength
f yk = Characteristic yield strength of reinforcement steel
ϕ y = Yield curvature [m -1 ]
ϕ u = slump curvature [m -1]
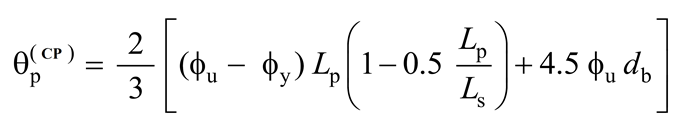
θ p (GÖ) = allowable plastic rotation limit for Pre- migration performance level [rad]
TBDY Section 5.8.1.2 As described in above, the stacked plastic behavior model that plastic hinges are calculated on the Prevention of immigrants (GO) Performance Level plastic rotation limit value for θ p (GO) , Eq. (5.6) is calculated by.
In the above relation, ϕ u represents the pre-failure curvature and ϕ y represents the yield curvature. The ϕ u and ϕ y values of the cross section in the plastic hinge region are found by the moment-curvature relation created using the concrete and reinforcement steel models given in TBDY Appendix 5A .
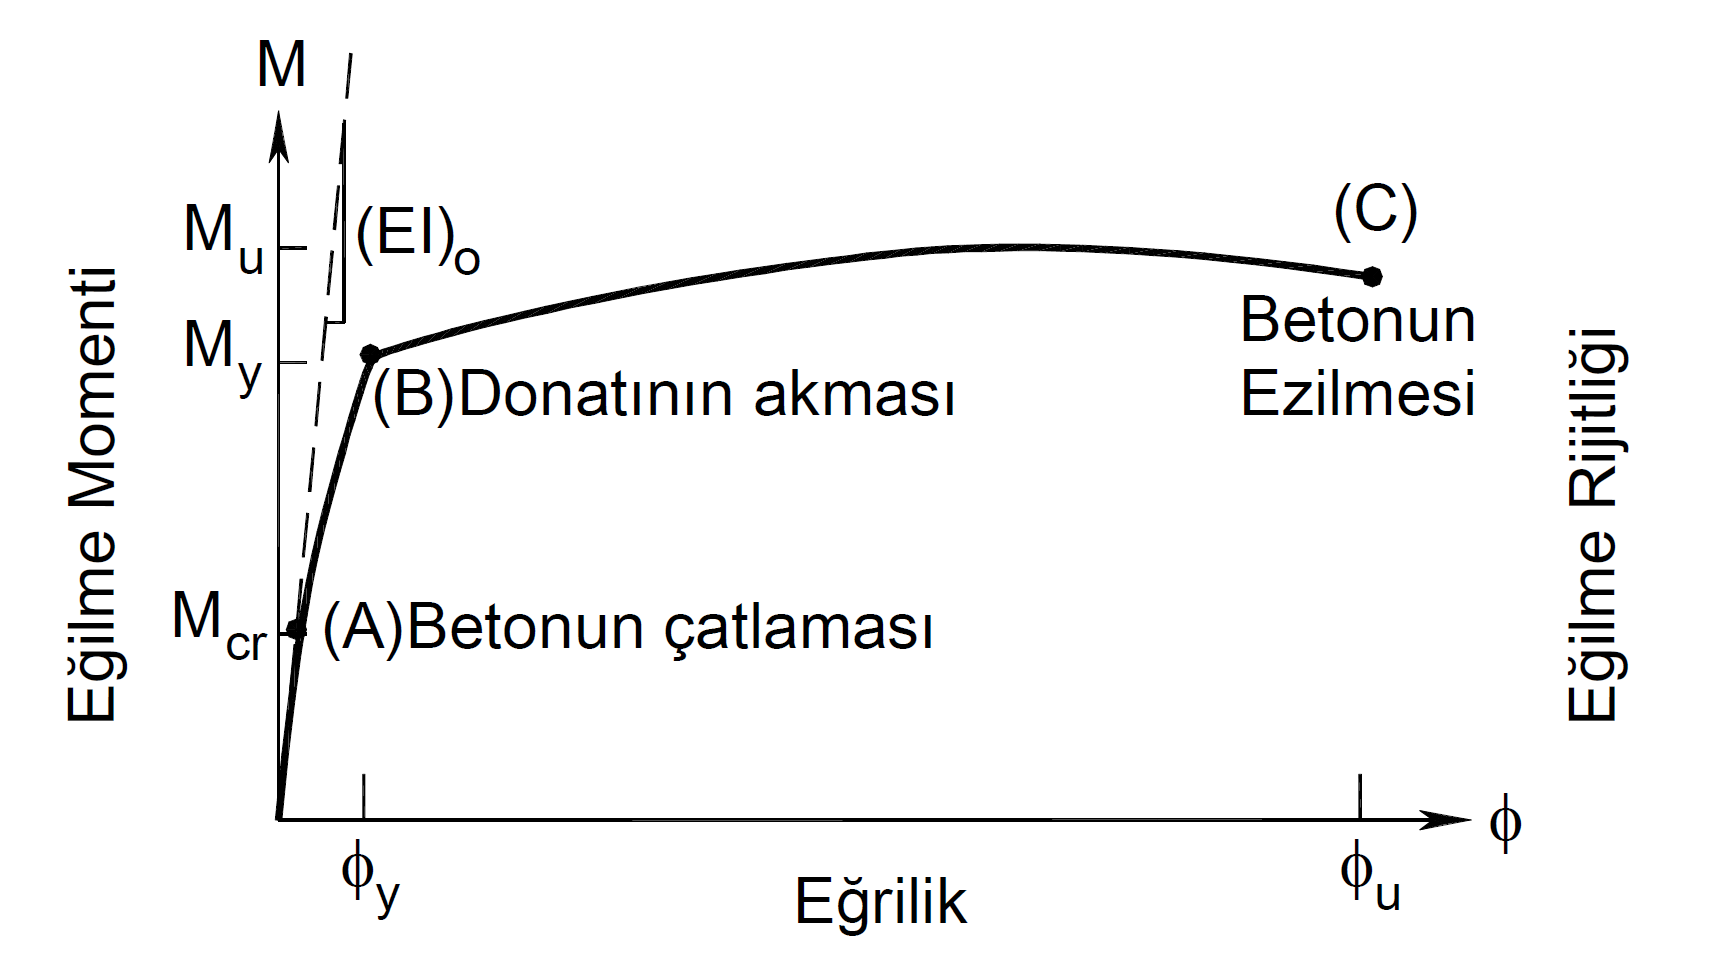
As seen in the picture above, the yield curvature ϕ y is the curvature that occurs when the tensile reinforcement flows in the section under the effect of bending moment. Immigration curvature φ u , crushing of concrete or plastic deformation of the section as a result of rupture of the reinforcement capability is calculated in the lost point where curvature. L p , plastic hinge length is calculated as half of the section height. L s is the cut clearance; It is taken as approximately half the span in columns and beams. d b is the average diameter of longitudinal rebars.
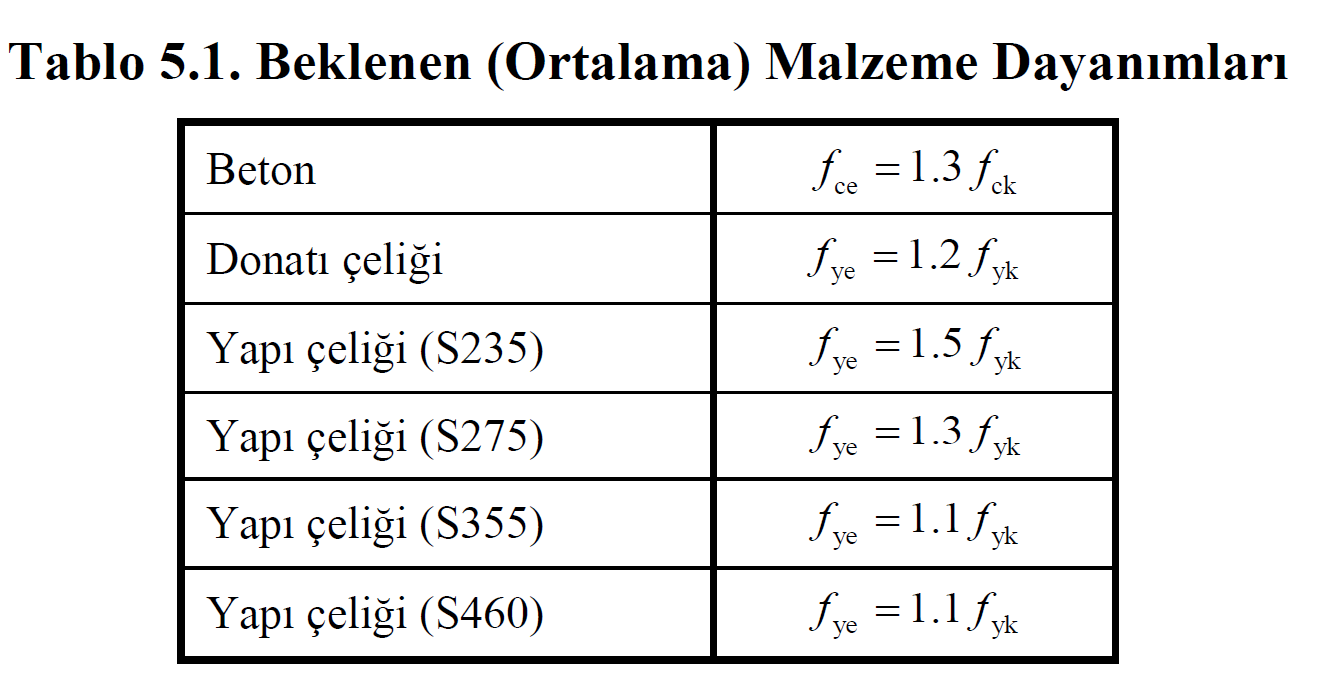
The material model to be used in the calculation of the plastic rotation limit value θ p ( DP) for the Prevention of Collapse (PP) Performance Level of newly constructed buildings is the concrete and reinforcement material models given in TBDY Annex 5A .In the title of Stress-Strain Curves for Concrete and Reinforcement Materials, how these material models are obtained is explained in detail. θp(GÖ)calculation are the Expected (Average) Material Strengths.
After the moment-curvature relationship is calculated, the stability curve of the plastic hinge is subtracted and then the rotation limits can be placed on this skeleton curve. The picture below shows a graph showing the moment-plastic rotation relationship. Plastic rotation limits for all performance levels are defined in this way and the damage status of the section is determined according to the plastic rotation result of the plastic joint.

TBDY Figure 5A.1 and Figure 5A.2 show the wrapped and uncoated concrete models and the reinforcement model. In these graphs, fco represents the compressive strength of the uncoated concrete and fsy represents the yield strength of the reinforcing steel. These values (f co and f sy ) are the basic values that determine the material strength. Since different material models are used in DGT, SGDT for new buildings and SGDT for existing buildings, fco and fsy values are also different from each other. Stress-Strain Curves for Concrete and Reinforcement Materials since they take different values, the plastic hinge properties and plastic rotation limit values calculated in these approaches will also be different.
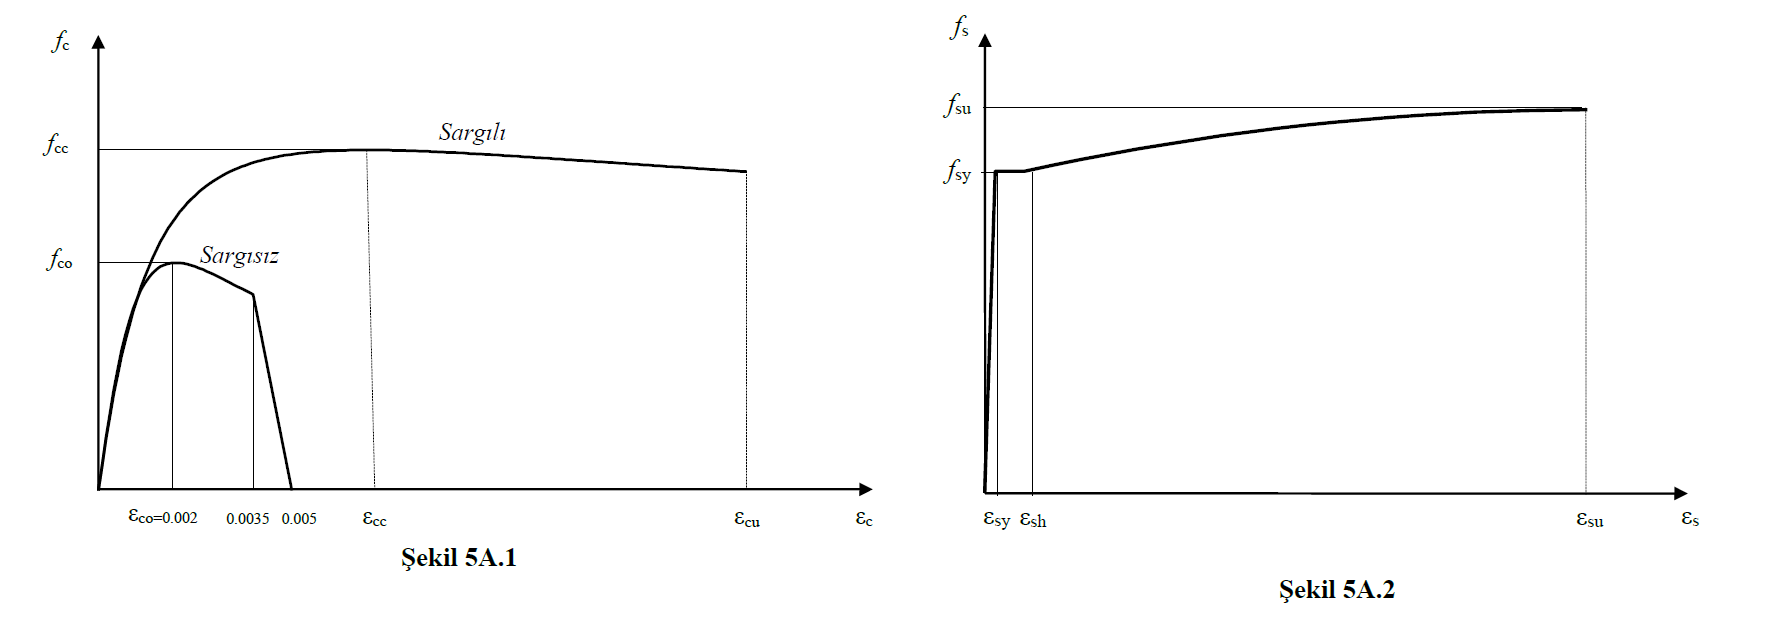
ŞGDT approach stacked with plastic behavior model to be used in new buildings Table 5.1 according to
concrete strength f co = 1.3f ck
reinforcement yield strength f sy = 1.2f yk
is considered. In this case , the material model relations in Figure 5A.1 and Figure 5A.2 are calculated according to these values.
The winding effect shown in Figure 5A.1 is calculated automatically according to the transverse reinforcement conditions of the section while calculating the moment-curvature relationship.
Next Topic