
You can examine the concrete design input on the building model.
Location of Concrete Design Input Feature
Ribbon menu Structural Inspection tab Input title under concrete, wall loads, elements sections, beam live load by clicking on one of the command Concrete Design can be accessed from the tab.
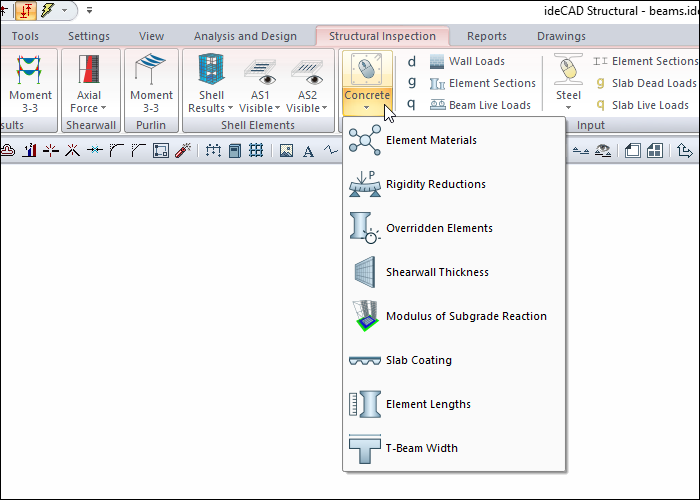
You can also access the Concrete Design tab by clicking the Analysis Model command under the ribbon menu, Concrete tab, Structural Inspection heading .
Design Input Types
|
Design input types and examples |
|---|
|
Element materials 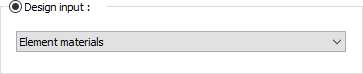
The materials defined for the elements are displayed on the elements in the display window. Elements with different materials are painted in different colors. From the color scale on the left of the screen, it can be seen which color represents which material. 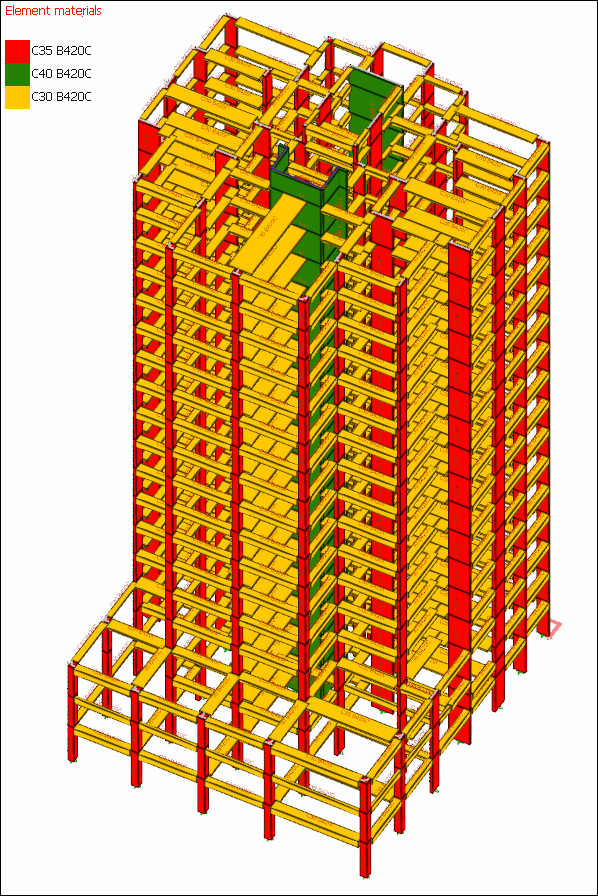
|
|
Element sections 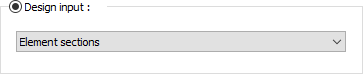
The sections used to the elements are displayed on the elements in the view window. Elements with different cross sections are painted in different colors. From the color scale on the left of the screen, you can see which color represents which section. 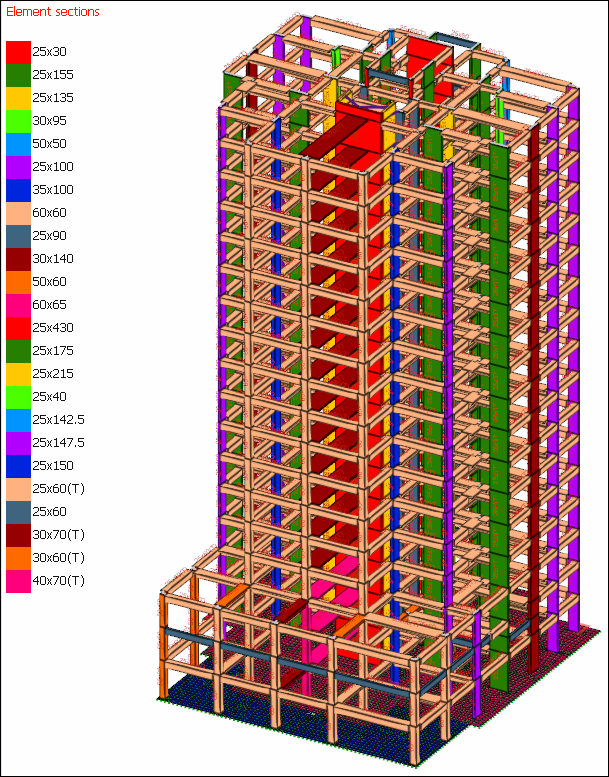
|
|
Element lengths 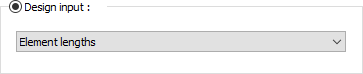
The lengths of the rod elements are shown in the display window. Elements with different lengths are painted in different colors. From the color scale on the left of the screen, you can see which color represents which length value. 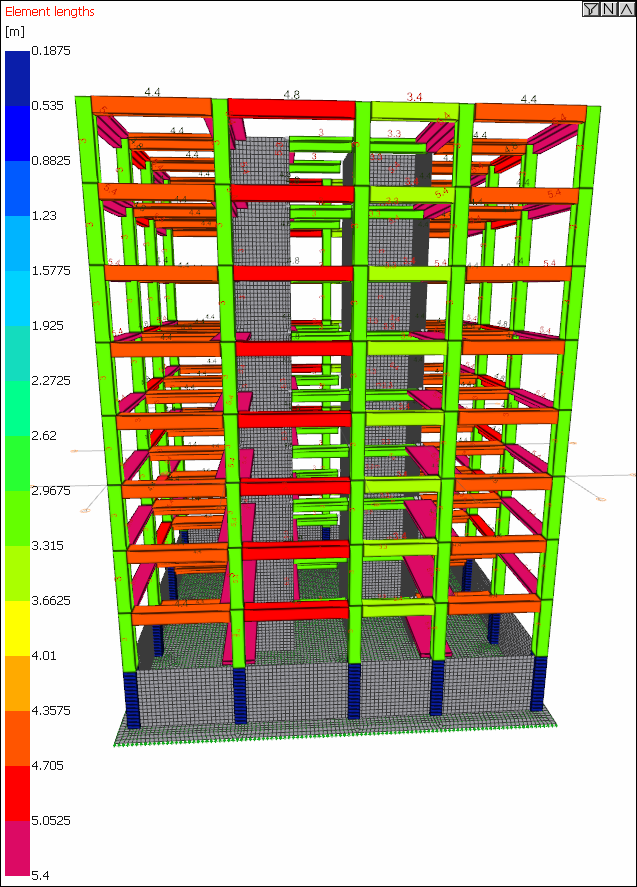
|
|
Stiffness reductions 
In the stiffness reduction tab in the element settings, the elements whose stiffness has been changed by the user are colored red in the display window. 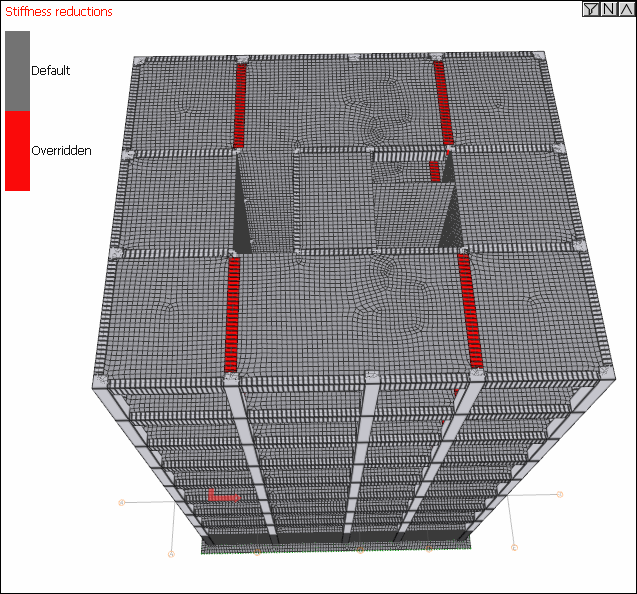
|
|
Overridden elements 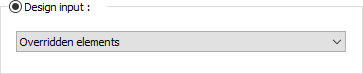
Stiffness reduction was made by the user, overridden section parameter was used, defined temperature parameter, etc. If there are elements whose element options have been modified, they are colored red in the view window. 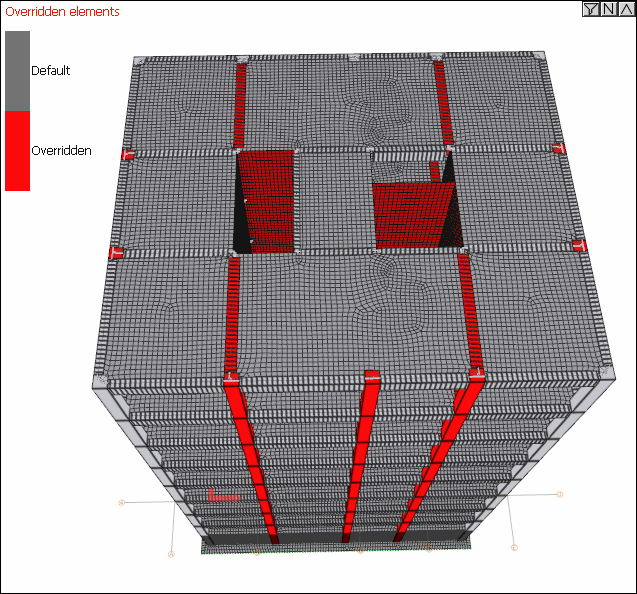
|
|
Shearwall groups 
It shows the shearwalls defined as shearwall group. 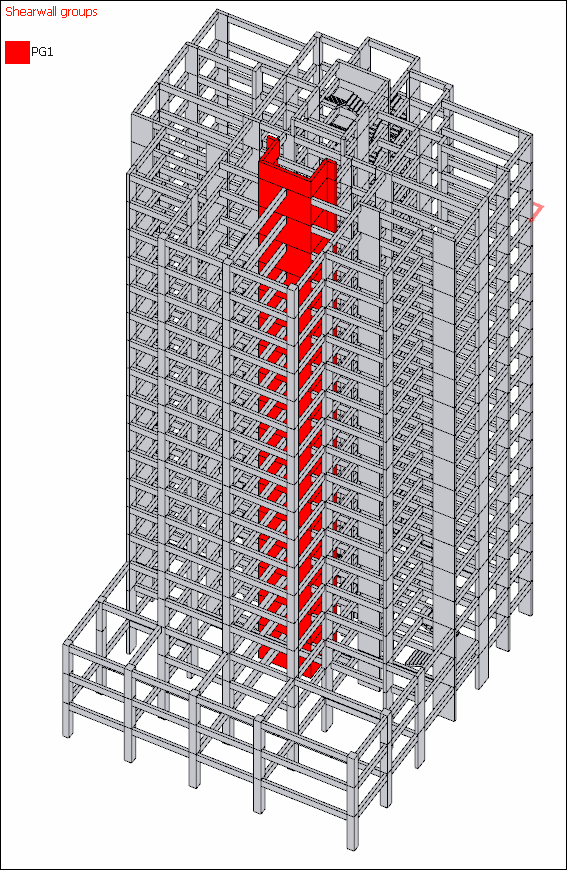
|
|
Shearwall thickness 
Shearwalls of different thickness appear in different colors in the view window. From the scale on the left of the screen, it can be seen which color corresponds to which thickness value. 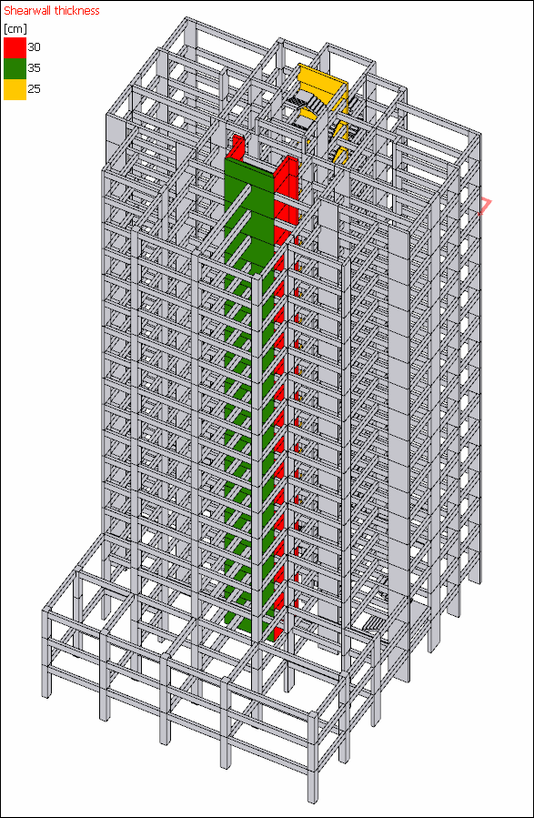
|
|
Shearwall types 
Different types of shearwalls are painted in different colors in the view window. From the color scale on the left of the screen, you can see which color represents which type. |
|
Slab thicknesses 
Slabs of different thicknesses are painted in different colors in the view window. From the color scale on the left of the screen, you can see which color represents which thickness. 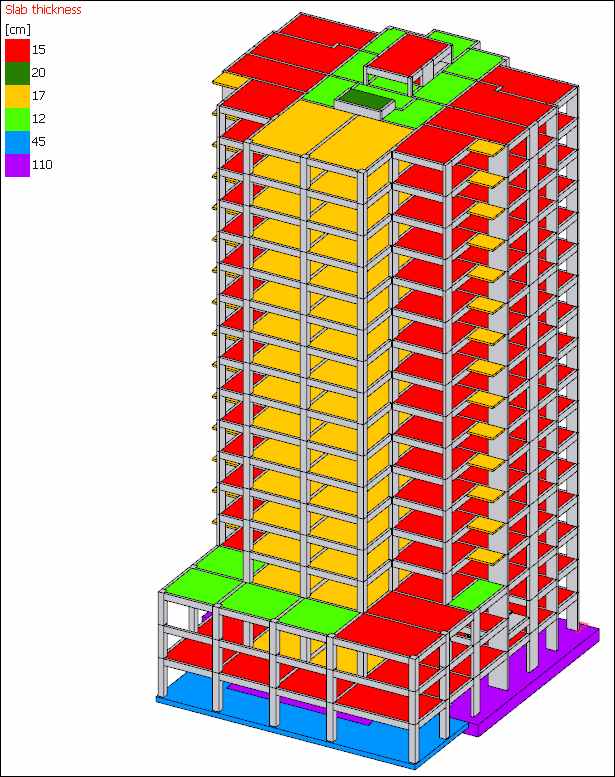
|
|
Slab coating loads 
The slabs with different coating loads are painted in different colors in the view window. From the color scale on the left of the screen, it can be seen which color represents which load. 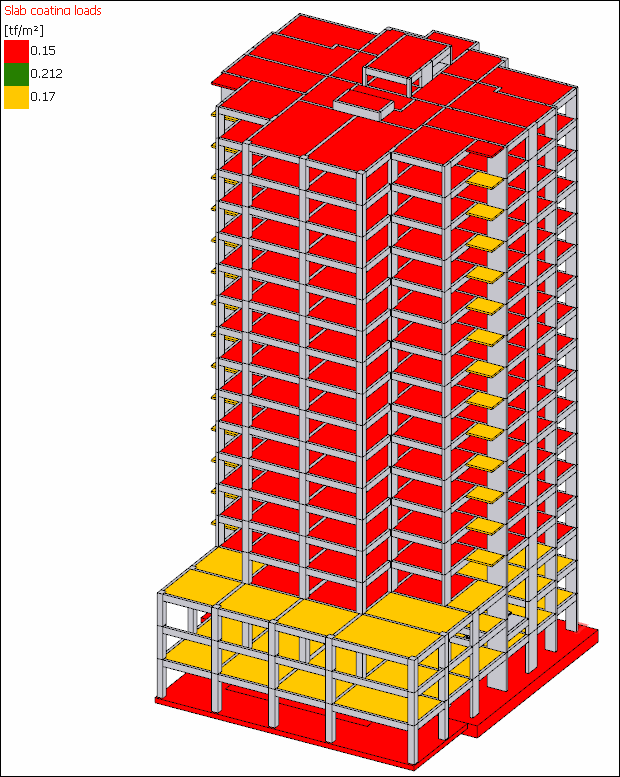
|
|
Slab total dead loads 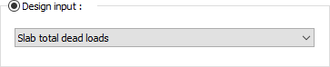
Lining loads and self weights of slabs are based on summation. Elements with different values are shown in different colors. From the scale on the left of the screen, it can be seen which color corresponds to which load value. 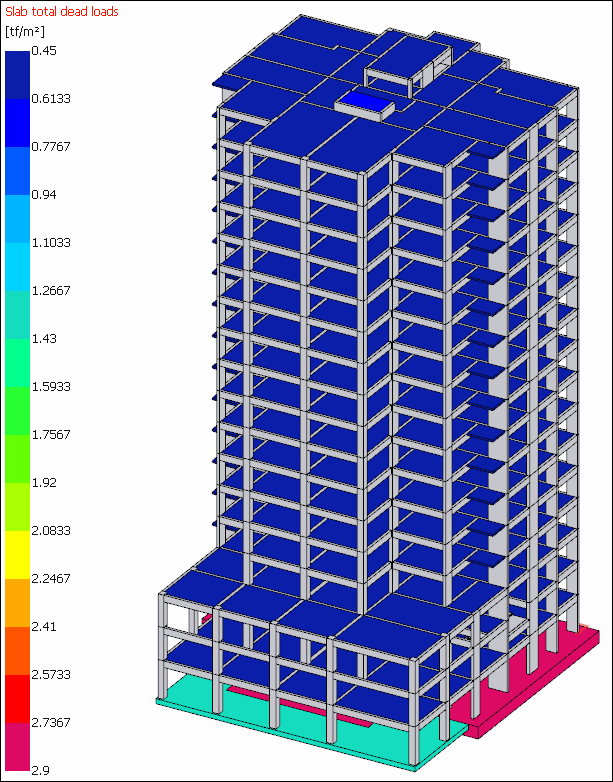
|
|
Slab live loads 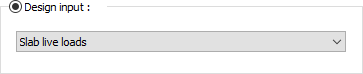
The slabs with different live loads are painted in different colors in the view window. From the color scale on the left of the screen, it can be seen which color represents which load. 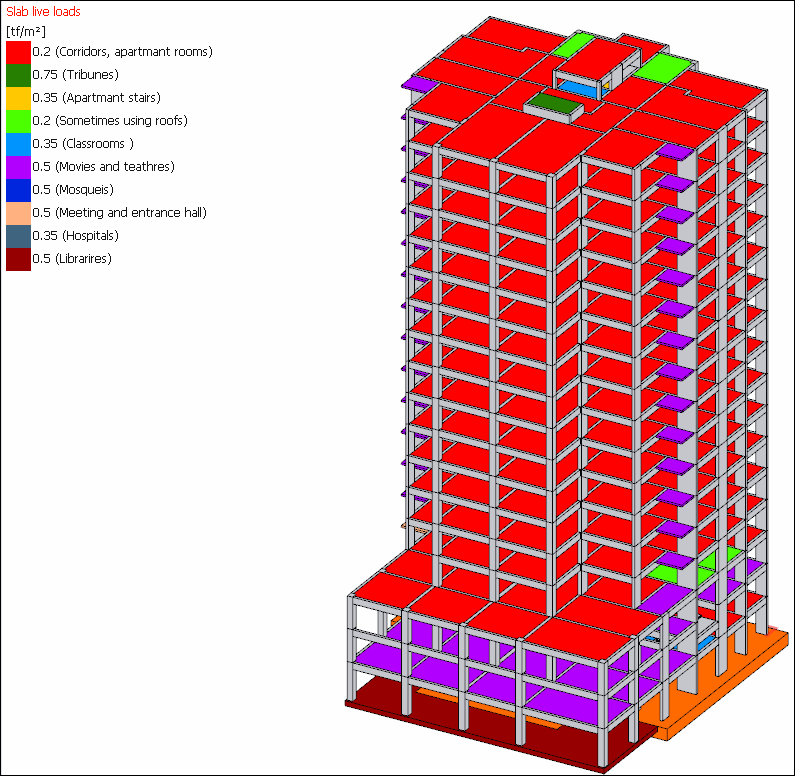
|
|
Wall loads 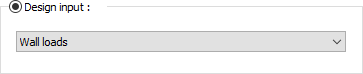
The wall loads defined for the beams are displayed on the beams in the view window. Beams with different wall loads are painted in a different color. From the scale on the left of the screen, it can be seen which color corresponds to which load value. 
|
|
Beam live loads 
Live loads defined to the beams are displayed on the beams in the view window. Beams with different live loads are painted in a different color. From the scale on the left of the screen, it can be seen which color corresponds to which load value. 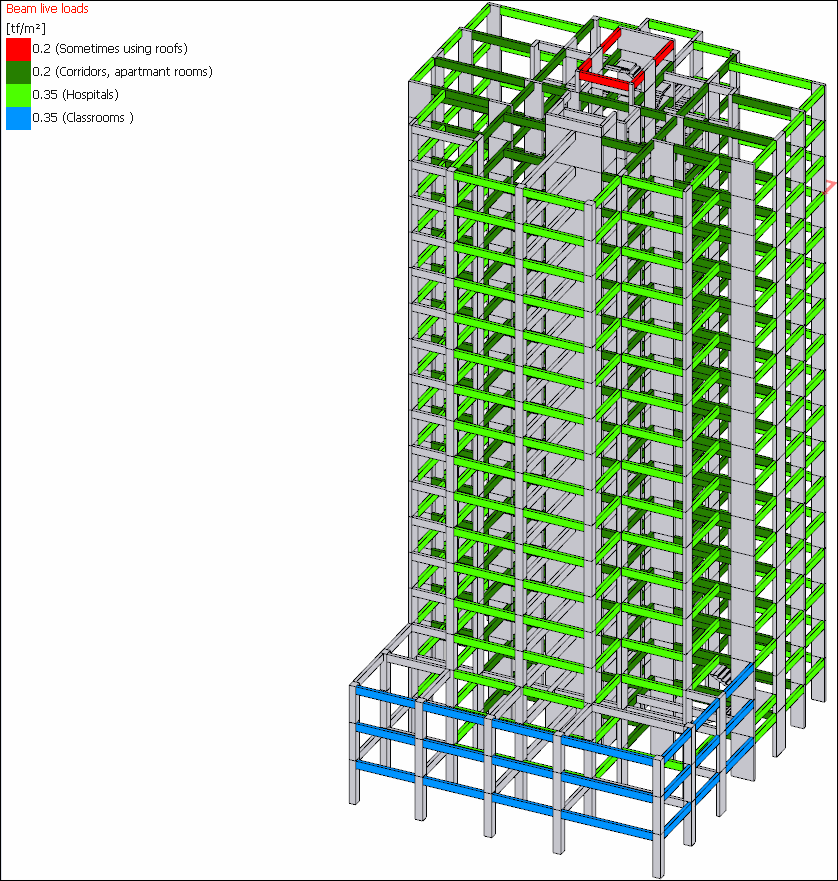
|
|
T - Beam width 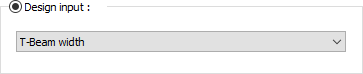
Beams with different plate widths appear in a different color in the view window. From the scale on the left of the screen, it can be seen which color corresponds to which length value. 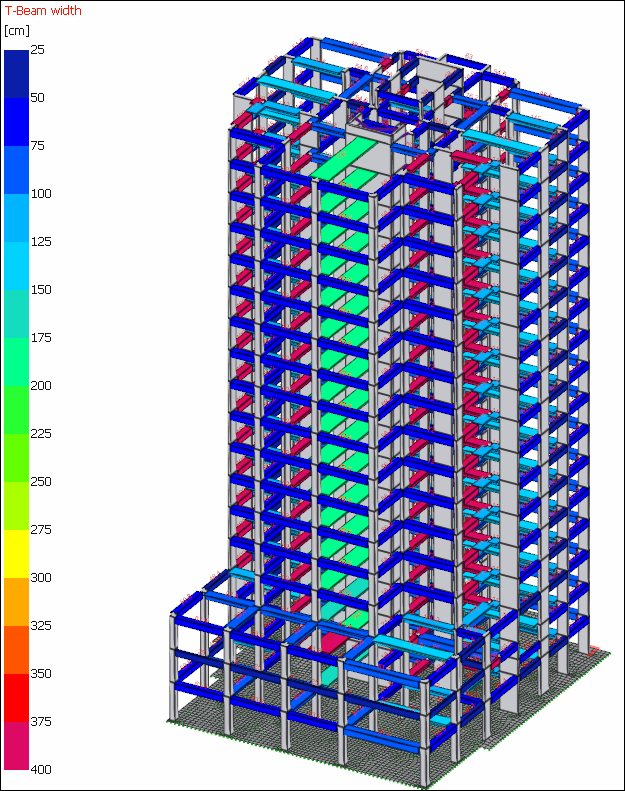
|
|
Modulus of subgrade reaction 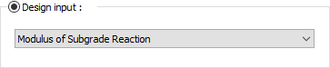
The bed coefficient value used is shown on raft plates. From the scale on the left of the screen, it can be seen which color corresponds to which bedding coefficient value. 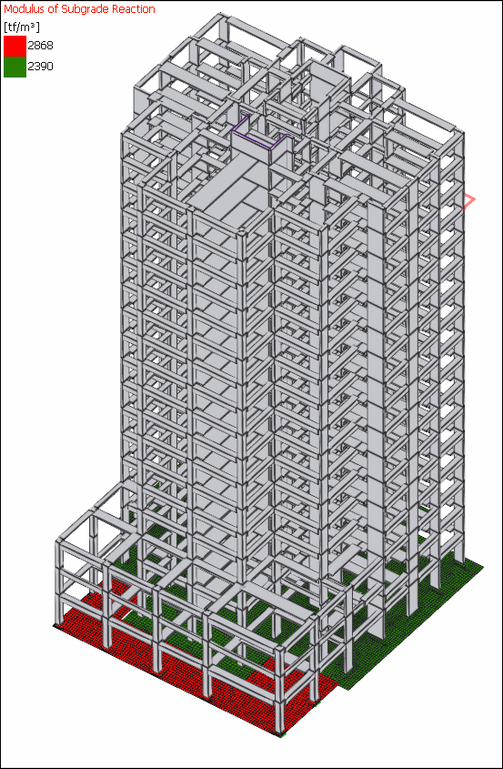
|
Concrete Design Tab
|
Specifications |
|---|
|
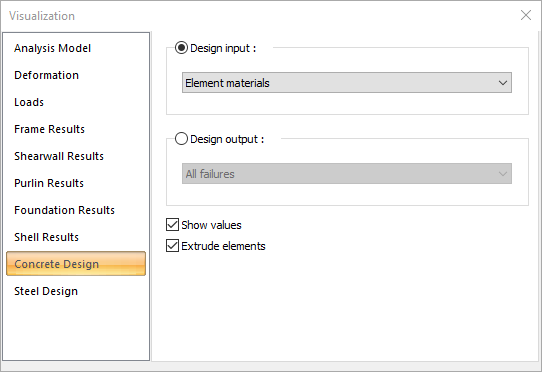
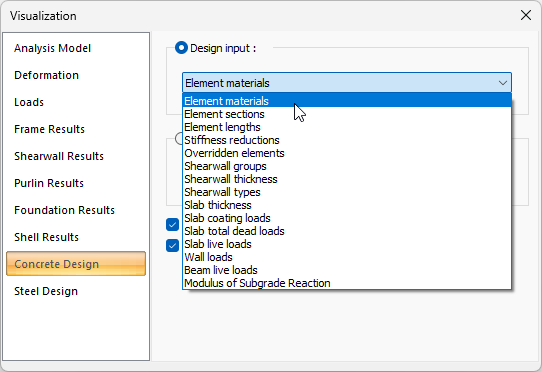
Design input 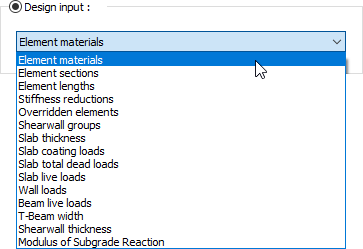
By selecting any of the options in the list, it is possible to display the input determined by the user on the building model in the view window. |
|
Design output 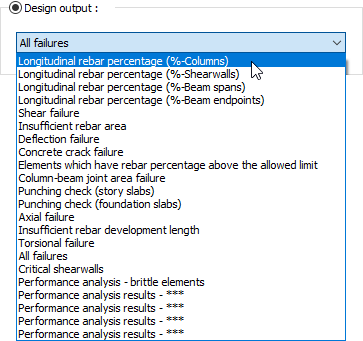
By selecting any of the options in the list, it is possible to display the input determined by the user on the building model in the view window. You can find detailed information on the title of concrete design outputs. |
|
Show values If checked, the values of the diagrams will be shown on the structure. |
|
Extrude elements If checked, the frame system is shown as solid (solid). If not checked, it is shown as a line (bar). |
Next Topic