
You can examine the steel design inputs on the building model.
By selecting any of the options in the list, it is possible to display the data determined by the user on the building model in the view window.
Location of the Steel Design Input Feature
Ribbon menu Structrual Inspection tab Input title under the steel element sections, dead and live loads, element length, by clicking on one of the sheeting own and snow loads commands Steel Design are available from the tab.
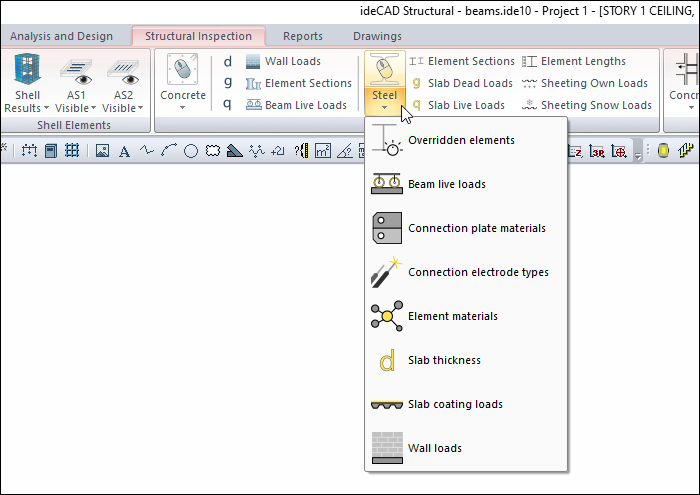
You can also access the Steel Design tab by clicking the Analysis Model command under the ribbon menu, Steel tab, Structural Inspection heading .
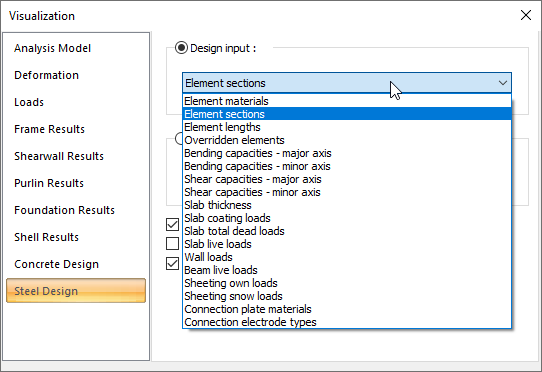
Design Input Types
|
Input types and examples |
|---|
|
Element materials 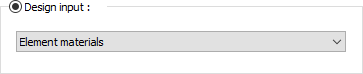
The materials defined by the user to the elements are displayed on the elements in the display window. Elements with different materials are painted in different colors. From the color scale on the left of the screen, it can be seen which color represents which material. 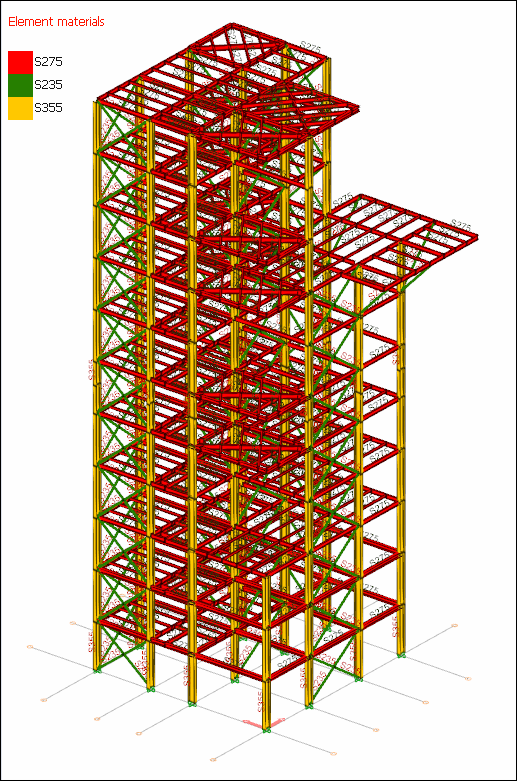
|
|
Element sections 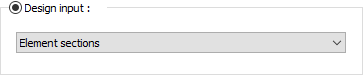
Sections defined to elements by the user are displayed on elements in the view window. Elements with different sections are painted in different colors. From the color scale on the left of the screen, you can see which color represents which section. 
|
|
Element lengths 
The lengths of elements are shown in the display window. Elements with different lengths are painted in different colors. From the color scale on the left of the screen, you can see which color represents which length value. |
|
Overridden elements 
If there are elements whose tip freedoms and design variables have been manipulated by the user, they are colored red in the view window. 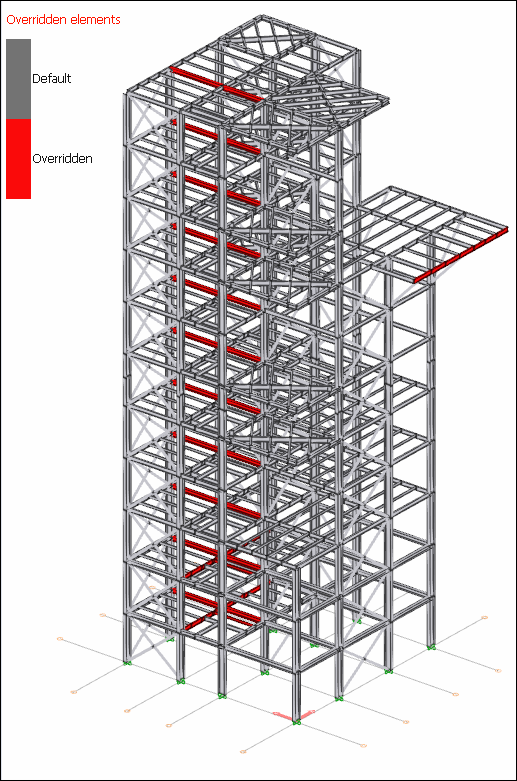
|
|
Bending capacities - major axis 
The elements are painted in different colors in the display window according to their bending capacity in their major axes. Which color shows which capacity value can be seen from the color scale on the left of the screen. 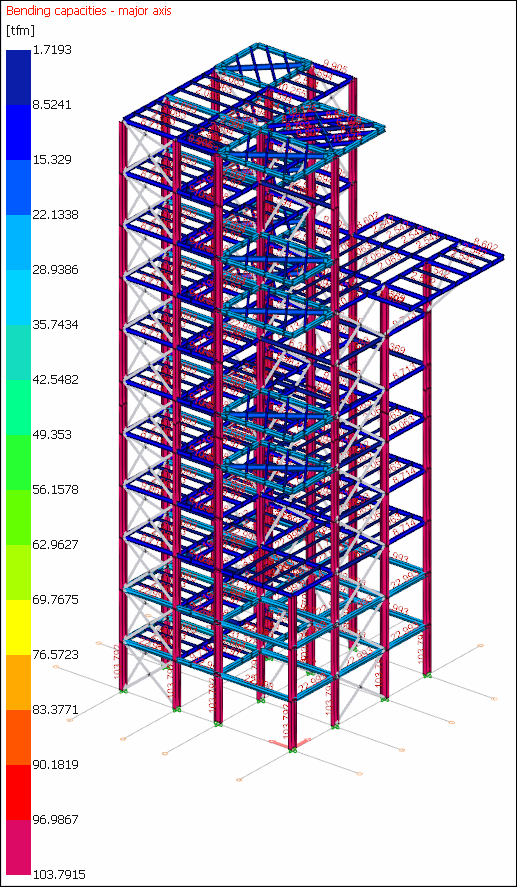
|
|
Bending capacities - minor axis 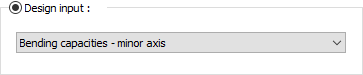
Elements are painted in different colors in the display window according to their bending capacities in their minor axes. Which color shows which capacity value can be seen from the color scale on the left of the screen. 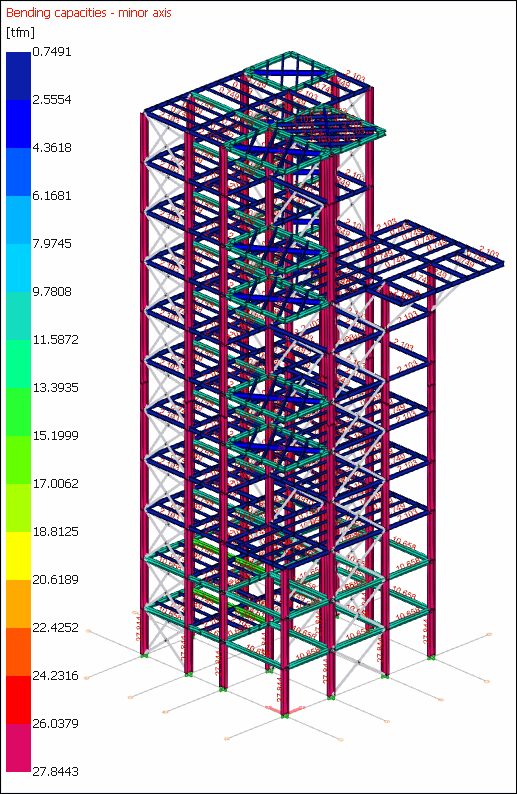
|
|
Shear capacities - major axis 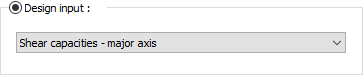
Elements are painted in different colors in the display window according to their shear capacity in their major axes. Which color shows which capacity value can be seen from the color scale on the left of the screen. 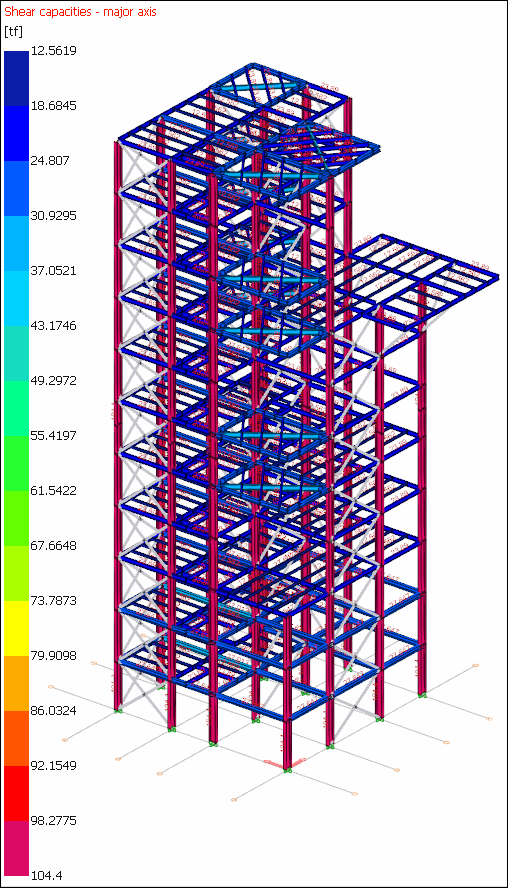
|
|
Shear capacities-minor axis 
Elements are painted in different colors in the display window according to their shear capacity in their minor axes. Which color shows which capacity value can be seen from the color scale on the left of the screen. 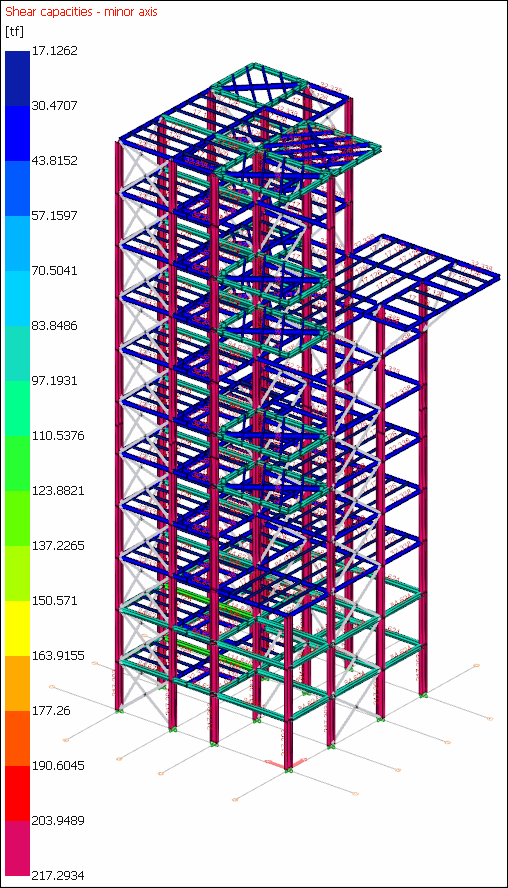
|
|
Slab thickness 
Slabs of different thicknesses are painted in different colors in the view window. From the color scale on the left of the screen, you can see which color represents which thickness. |
|
Slab coating loads 
The slabs with different coating loads are painted in different colors in the view window. From the color scale on the left of the screen, it can be seen which color represents which load. |
|
Slab total dead loads 
Lining loads and self weights of slabs are based on summation. Elements with different values are shown in different colors. From the scale on the left of the screen, it can be seen which color corresponds to which load value. |
|
Slab live loads 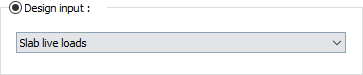
The slabs with different live loads are painted in different colors in the view window. From the color scale on the left of the screen, it can be seen which color represents which load. |
|
Wall loads 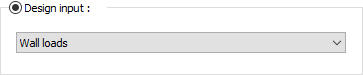
The wall loads defined for the beams are displayed on the beams in the view window. Beams with different wall loads are painted in a different color. From the scale on the left of the screen, it can be seen which color corresponds to which load value. |
|
Beam live loads 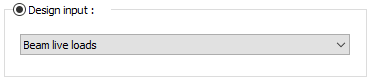
Live loads defined to the beams are displayed on the beams in the view window. Beams with different live loads are painted in a different color. From the scale on the left of the screen, it can be seen which color corresponds to which load value. |
|
Sheeting own loads 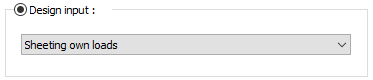
Sheetings of different own weight are dyed in a different color in the view window. From the scale on the left of the screen, it can be seen which color corresponds to which load value. |
|
Sheeting snow loads 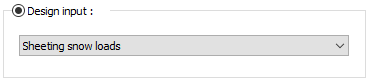
Sheetings with different snow loads are painted in a different color in the view window. From the scale on the left of the screen, it can be seen which color corresponds to which load value. |
|
Connection plate materials 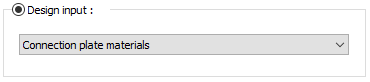
The materials defined by the user to the connections are displayed on the connections in the display window. Compounds with different materials are painted in different colors. From the color scale on the left of the screen, it can be seen which color represents which material. |
|
Connection electrode types 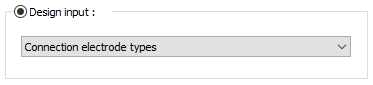
The type of connection electrodes defined by the user for the connections is displayed on the connections in the display window. Connections with different electrodes are painted in different colors. From the color scale on the left of the screen, it can be seen which color represents which electrode. |
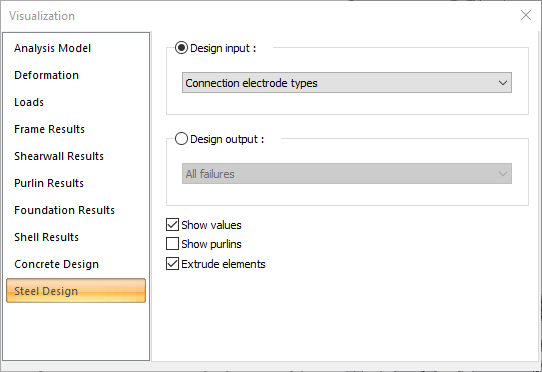
Steel Design Tab
|
Specifications |
|---|
|
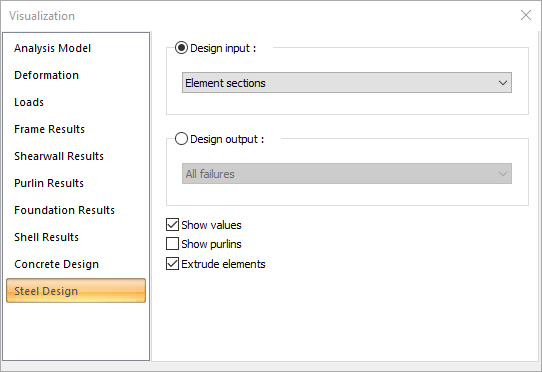
Design input 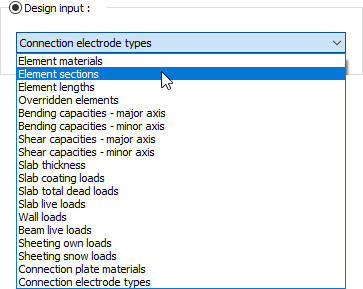
By selecting any of the options in the list, it is possible to display the input determined by the user on the building model in the view window. |
|
Design output 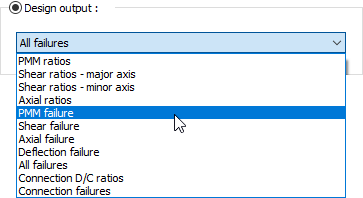
By selecting any of the options in the list, it is possible to display the data determined by the user on the building model in the view window. You can find detailed information on the steel design outputs section. |
|
Show values
If checked, the values of the diagrams will be shown on the structure. |
|
Show purlins
If it is marked, it allows the steel purlins to be displayed on the 3D frame. |
|
Extrude elements
If checked, the frame system is shown as solid (solid). If not checked, it is shown as a line (bar). |
Next Topic